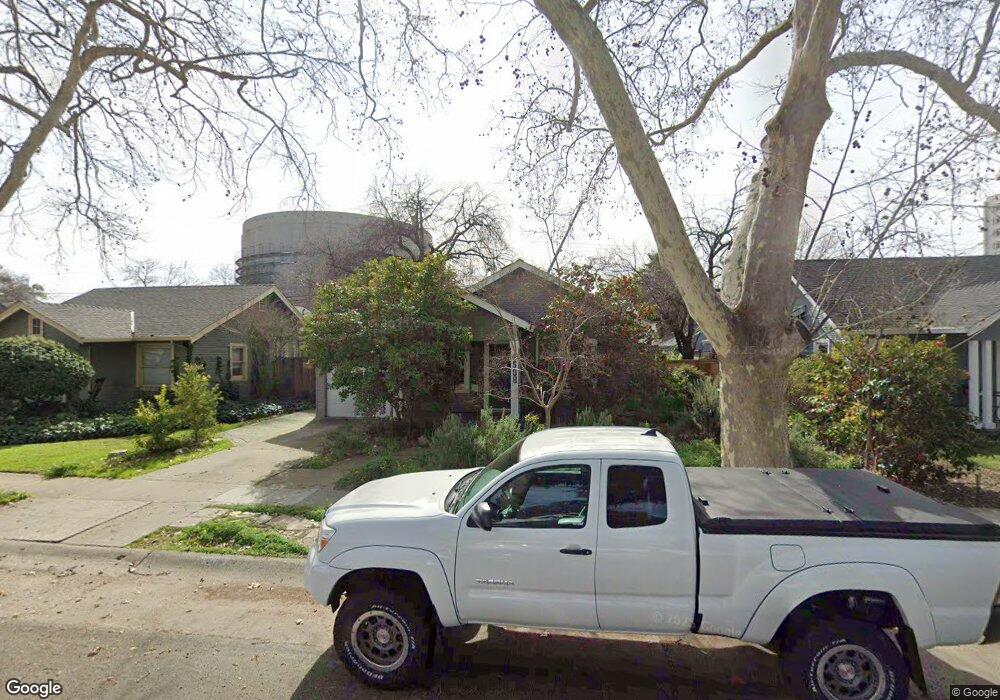
4508 U St Sacramento, CA 95817
Elmhurst NeighborhoodEstimated Value: $371,000 - $591,000
2
Beds
1
Bath
1,109
Sq Ft
$476/Sq Ft
Est. Value
About This Home
This home is located at 4508 U St, Sacramento, CA 95817 and is currently estimated at $528,265, approximately $476 per square foot. 4508 U St is a home located in Sacramento County with nearby schools including David Lubin Elementary, Umoja International Academy, and Hiram W. Johnson High School.
Ownership History
Date
Name
Owned For
Owner Type
Purchase Details
Closed on
Sep 10, 2019
Sold by
Conner Charles V and Dunaway Kendall
Bought by
Conner Charles V and Dunaway Kendall J
Current Estimated Value
Purchase Details
Closed on
May 28, 2002
Sold by
Conner Charles V
Bought by
Conner Charles V and Dunaway Kendall
Home Financials for this Owner
Home Financials are based on the most recent Mortgage that was taken out on this home.
Original Mortgage
$33,761
Outstanding Balance
$14,295
Interest Rate
6.83%
Estimated Equity
$513,970
Purchase Details
Closed on
Jul 17, 1998
Sold by
Bilek Cynthia L
Bought by
Conner Charles V
Home Financials for this Owner
Home Financials are based on the most recent Mortgage that was taken out on this home.
Original Mortgage
$142,500
Outstanding Balance
$29,187
Interest Rate
7.01%
Estimated Equity
$499,078
Create a Home Valuation Report for This Property
The Home Valuation Report is an in-depth analysis detailing your home's value as well as a comparison with similar homes in the area
Home Values in the Area
Average Home Value in this Area
Purchase History
| Date | Buyer | Sale Price | Title Company |
|---|---|---|---|
| Conner Charles V | -- | None Available | |
| Conner Charles V | -- | Stewart Title | |
| Conner Charles V | $150,000 | Placer Title Company |
Source: Public Records
Mortgage History
| Date | Status | Borrower | Loan Amount |
|---|---|---|---|
| Open | Conner Charles V | $33,761 | |
| Open | Conner Charles V | $142,500 |
Source: Public Records
Tax History
| Year | Tax Paid | Tax Assessment Tax Assessment Total Assessment is a certain percentage of the fair market value that is determined by local assessors to be the total taxable value of land and additions on the property. | Land | Improvement |
|---|---|---|---|---|
| 2025 | $2,736 | $235,128 | $62,695 | $172,433 |
| 2024 | $2,736 | $230,518 | $61,466 | $169,052 |
| 2023 | $2,670 | $225,999 | $60,261 | $165,738 |
| 2022 | $2,623 | $221,569 | $59,080 | $162,489 |
| 2021 | $2,498 | $217,225 | $57,922 | $159,303 |
| 2020 | $2,517 | $214,999 | $57,329 | $157,670 |
| 2019 | $2,462 | $210,784 | $56,205 | $154,579 |
| 2018 | $2,397 | $206,652 | $55,103 | $151,549 |
| 2017 | $2,362 | $202,601 | $54,023 | $148,578 |
| 2016 | $2,291 | $198,629 | $52,964 | $145,665 |
| 2015 | $2,256 | $195,646 | $52,169 | $143,477 |
| 2014 | $2,195 | $191,815 | $51,148 | $140,667 |
Source: Public Records
Map
Nearby Homes
Your Personal Tour Guide
Ask me questions while you tour the home.