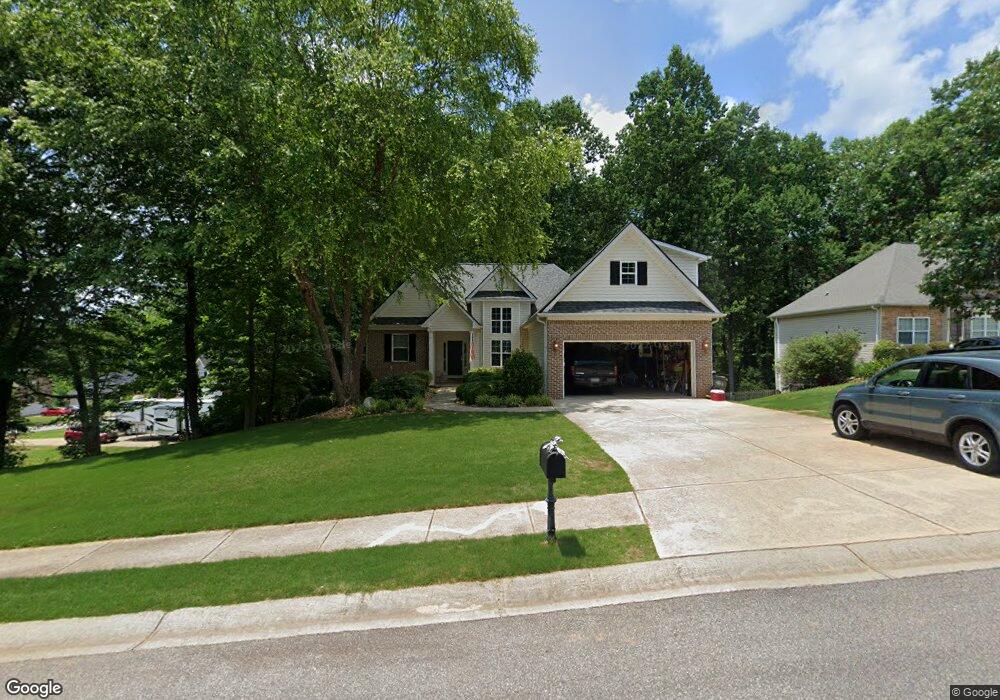
4509 Hoskins Dr Gainesville, GA 30506
Estimated Value: $414,000 - $585,000
5
Beds
4
Baths
3,875
Sq Ft
$126/Sq Ft
Est. Value
About This Home
This home is located at 4509 Hoskins Dr, Gainesville, GA 30506 and is currently estimated at $488,572, approximately $126 per square foot. 4509 Hoskins Dr is a home located in Hall County with nearby schools including Lanier Elementary School, Chestatee Middle School, and Chestatee High School.
Ownership History
Date
Name
Owned For
Owner Type
Purchase Details
Closed on
Sep 23, 2006
Sold by
Popham Randall
Bought by
Popham Randall
Current Estimated Value
Purchase Details
Closed on
Sep 22, 2006
Sold by
Popham Randall
Bought by
Popham Randall
Purchase Details
Closed on
Dec 9, 2005
Sold by
Popham Randall
Bought by
Popham Randall
Home Financials for this Owner
Home Financials are based on the most recent Mortgage that was taken out on this home.
Original Mortgage
$45,600
Interest Rate
5.72%
Mortgage Type
New Conventional
Purchase Details
Closed on
Oct 6, 2005
Sold by
Renaissance Construction Group I
Bought by
Popham Randall
Home Financials for this Owner
Home Financials are based on the most recent Mortgage that was taken out on this home.
Original Mortgage
$45,600
Interest Rate
5.72%
Mortgage Type
New Conventional
Purchase Details
Closed on
Sep 16, 2004
Sold by
Highway 53 Properties Inc
Bought by
Dc&L Sardis Llc
Create a Home Valuation Report for This Property
The Home Valuation Report is an in-depth analysis detailing your home's value as well as a comparison with similar homes in the area
Home Values in the Area
Average Home Value in this Area
Purchase History
| Date | Buyer | Sale Price | Title Company |
|---|---|---|---|
| Popham Randall | -- | -- | |
| Popham Randall | -- | -- | |
| Popham Randall | -- | -- | |
| Popham Randall | $228,000 | -- | |
| Dc&L Sardis Llc | $806,200 | -- |
Source: Public Records
Mortgage History
| Date | Status | Borrower | Loan Amount |
|---|---|---|---|
| Previous Owner | Popham Randall | $45,600 | |
| Previous Owner | Popham Randall | $182,400 |
Source: Public Records
Tax History Compared to Growth
Tax History
| Year | Tax Paid | Tax Assessment Tax Assessment Total Assessment is a certain percentage of the fair market value that is determined by local assessors to be the total taxable value of land and additions on the property. | Land | Improvement |
|---|---|---|---|---|
| 2024 | $4,738 | $187,120 | $26,520 | $160,600 |
| 2023 | $4,089 | $175,960 | $28,680 | $147,280 |
| 2022 | $4,422 | $166,760 | $28,040 | $138,720 |
| 2021 | $3,456 | $124,880 | $12,240 | $112,640 |
| 2020 | $3,370 | $118,080 | $12,240 | $105,840 |
| 2019 | $3,229 | $111,880 | $12,240 | $99,640 |
| 2018 | $3,188 | $106,800 | $10,200 | $96,600 |
| 2017 | $2,857 | $96,120 | $10,200 | $85,920 |
| 2016 | $2,790 | $96,120 | $10,200 | $85,920 |
| 2015 | $2,589 | $89,680 | $8,160 | $81,520 |
| 2014 | $2,589 | $88,120 | $6,600 | $81,520 |
Source: Public Records
Map
Nearby Homes
- 4606 Enfield Dr
- 4722 Middleboro Ln
- 4704 Hanson Hills Ct
- 4522 Old Princeton Ridge
- 4135 Cha Co Rd
- 4506 Old Princeton Ridge Unit 1
- 4409 Waterman Dr
- 3292 High View Ct
- 3286 High View Ct
- 4363 Sardis Rd
- 4340 Oak Creek Dr
- 4232 Green Valley Dr
- 4466 Sardis Dr
- 3579 Sequoia Rd
- 4719 Giddon Martin Rd
- 4312 Green Hill Rd
- 4513 Hoskins Dr
- 4517 Hoskins Dr Unit 3
- 4528 Hoskins Dr
- 0 Hoskins Dr Unit 3176581
- 0 Hoskins Dr Unit 8004168
- 0 Hoskins Dr Unit 7631119
- 4630 Enfield Dr Unit 2
- 4620 Enfield Dr Unit 2
- 4521 Hoskins Dr Unit 3
- 4508 Hoskins Dr
- 4480 Enfield Dr Unit 2
- 4607 Enfield Dr
- 4512 Hoskins Dr
- 4603 Enfield Dr
- 4634 Enfield Dr Unit 82
- 4639 Enfield Dr
- 4634 Enfield Dr
- 4611 Enfield Dr
- 4516 Hoskins Dr
- 4638 Enfield Dr Unit LOT 2