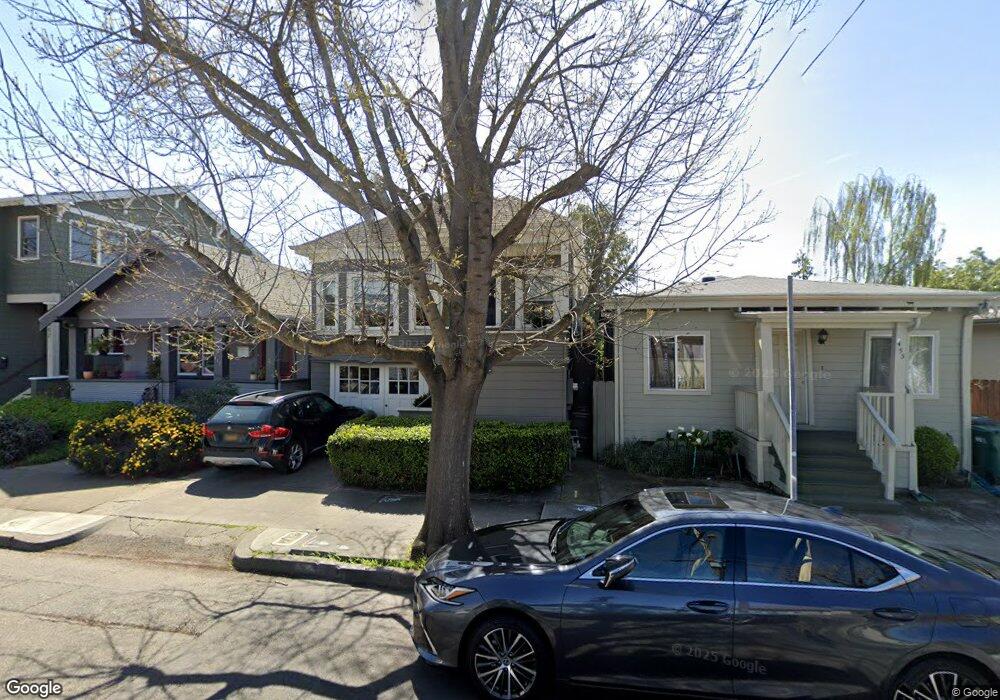
451 43rd St Oakland, CA 94609
Temescal NeighborhoodEstimated Value: $733,686 - $1,204,000
2
Beds
1
Bath
906
Sq Ft
$988/Sq Ft
Est. Value
About This Home
This home is located at 451 43rd St, Oakland, CA 94609 and is currently estimated at $895,422, approximately $988 per square foot. 451 43rd St is a home located in Alameda County with nearby schools including Emerson Elementary School, Claremont Middle School, and Oakland Technical High School.
Ownership History
Date
Name
Owned For
Owner Type
Purchase Details
Closed on
Jun 22, 2020
Sold by
Graham Jennifer
Bought by
Graham Jennifer and The Jennifer Graham Living Tru
Current Estimated Value
Purchase Details
Closed on
Oct 7, 2009
Sold by
Caballero Anthony and Graham Jennifer
Bought by
Graham Jennifer
Purchase Details
Closed on
May 13, 2008
Sold by
Graham Jennifer
Bought by
Graham Jennifer and Caballero Anthony
Home Financials for this Owner
Home Financials are based on the most recent Mortgage that was taken out on this home.
Original Mortgage
$417,000
Outstanding Balance
$263,946
Interest Rate
5.87%
Mortgage Type
Purchase Money Mortgage
Estimated Equity
$631,476
Purchase Details
Closed on
Mar 23, 1995
Sold by
Zulim Victoria and Martellacci Rose
Bought by
Graham Jennifer
Home Financials for this Owner
Home Financials are based on the most recent Mortgage that was taken out on this home.
Original Mortgage
$118,750
Interest Rate
6.5%
Create a Home Valuation Report for This Property
The Home Valuation Report is an in-depth analysis detailing your home's value as well as a comparison with similar homes in the area
Home Values in the Area
Average Home Value in this Area
Purchase History
| Date | Buyer | Sale Price | Title Company |
|---|---|---|---|
| Graham Jennifer | -- | None Available | |
| Graham Jennifer | -- | None Available | |
| Graham Jennifer | $208,500 | Financial Title Company | |
| Graham Jennifer | $125,000 | First American Title Company |
Source: Public Records
Mortgage History
| Date | Status | Borrower | Loan Amount |
|---|---|---|---|
| Open | Graham Jennifer | $417,000 | |
| Previous Owner | Graham Jennifer | $118,750 |
Source: Public Records
Tax History
| Year | Tax Paid | Tax Assessment Tax Assessment Total Assessment is a certain percentage of the fair market value that is determined by local assessors to be the total taxable value of land and additions on the property. | Land | Improvement |
|---|---|---|---|---|
| 2025 | $4,363 | $202,950 | $62,985 | $146,965 |
| 2024 | $4,363 | $198,834 | $61,750 | $144,084 |
| 2023 | $4,480 | $201,800 | $60,540 | $141,260 |
| 2022 | $4,304 | $190,843 | $59,353 | $138,490 |
| 2021 | $3,994 | $186,964 | $58,189 | $135,775 |
| 2020 | $3,948 | $191,975 | $57,592 | $134,383 |
| 2019 | $3,723 | $188,211 | $56,463 | $131,748 |
| 2018 | $3,647 | $184,521 | $55,356 | $129,165 |
| 2017 | $3,479 | $180,904 | $54,271 | $126,633 |
| 2016 | $3,290 | $177,358 | $53,207 | $124,151 |
| 2015 | $3,269 | $174,694 | $52,408 | $122,286 |
| 2014 | $3,216 | $171,273 | $51,382 | $119,891 |
Source: Public Records
Map
Nearby Homes
- 4067 Shafter Ave
- 4611 Shattuck Ave
- 3920 Clarke St
- 4617 Shattuck Ave
- 367 41st St
- 359 41st St
- 4045 Manila Ave
- 382 50th St
- 662 45th St
- 4949 Coronado Ave
- 485 W Macarthur Blvd Unit 407
- 5115 Lawton Ave
- 548 37th St
- 4970 Coronado Ave
- 4300 West St
- 551 53rd St
- 4135 West St
- 829 51st St
- 735 Apgar St
- 5229 Miles Ave
Your Personal Tour Guide
Ask me questions while you tour the home.