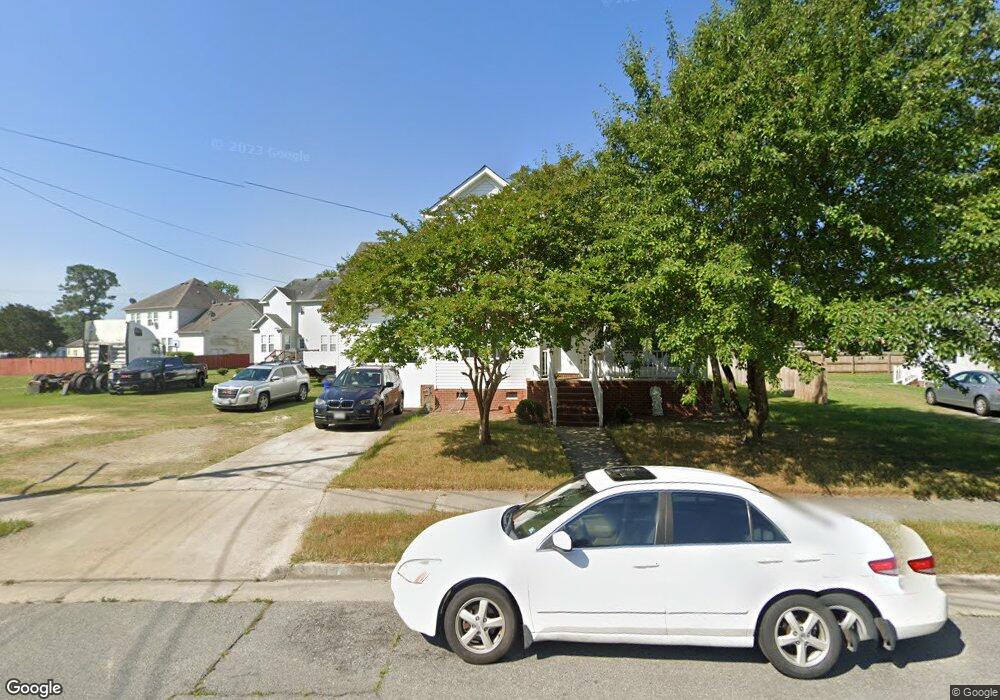
451 Bruce St Franklin, VA 23851
Estimated Value: $235,000 - $263,863
3
Beds
3
Baths
2,028
Sq Ft
$125/Sq Ft
Est. Value
About This Home
This home is located at 451 Bruce St, Franklin, VA 23851 and is currently estimated at $252,966, approximately $124 per square foot. 451 Bruce St is a home located in Franklin City with nearby schools including S.P. Morton Elementary School, Joseph P. King Jr. Middle School, and Franklin High School.
Ownership History
Date
Name
Owned For
Owner Type
Purchase Details
Closed on
Sep 26, 2012
Sold by
J C Land Ventures Llc
Bought by
George Barron Joseph Liv Trust
Current Estimated Value
Purchase Details
Closed on
Mar 20, 2007
Sold by
Story Avis L
Bought by
Jc Land Ventures Llc
Create a Home Valuation Report for This Property
The Home Valuation Report is an in-depth analysis detailing your home's value as well as a comparison with similar homes in the area
Home Values in the Area
Average Home Value in this Area
Purchase History
| Date | Buyer | Sale Price | Title Company |
|---|---|---|---|
| George Barron Joseph Liv Trust | $100,000 | -- | |
| Jc Land Ventures Llc | $50,000 | -- |
Source: Public Records
Tax History
| Year | Tax Paid | Tax Assessment Tax Assessment Total Assessment is a certain percentage of the fair market value that is determined by local assessors to be the total taxable value of land and additions on the property. | Land | Improvement |
|---|---|---|---|---|
| 2025 | $2,029 | $197,000 | $16,500 | $180,500 |
| 2024 | $2,029 | $197,000 | $16,500 | $180,500 |
| 2023 | $1,473 | $143,000 | $10,500 | $132,500 |
| 2022 | $1,473 | $143,000 | $10,500 | $132,500 |
| 2021 | $1,323 | $128,400 | $9,500 | $118,900 |
| 2020 | $1,335 | $128,400 | $9,500 | $118,900 |
| 2019 | $1,335 | $134,800 | $15,200 | $119,600 |
| 2018 | $1,335 | $134,800 | $15,200 | $119,600 |
| 2017 | $1,302 | $131,500 | $14,400 | $117,100 |
| 2016 | $1,302 | $131,500 | $14,400 | $117,100 |
| 2015 | -- | $0 | $0 | $0 |
| 2014 | -- | $0 | $0 | $0 |
| 2013 | -- | $0 | $0 | $0 |
Source: Public Records
Map
Nearby Homes
Your Personal Tour Guide
Ask me questions while you tour the home.