Estimated Value: $540,000 - $566,000
3
Beds
3
Baths
1,514
Sq Ft
$364/Sq Ft
Est. Value
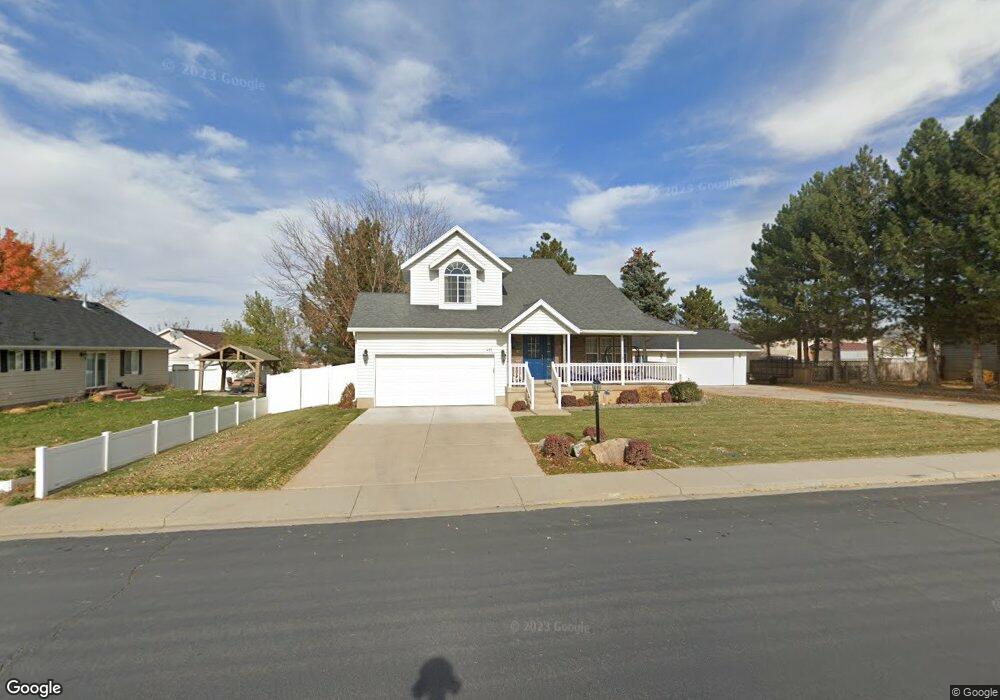
About This Home
This home is located at 451 E 620 S, Salem, UT 84653 and is currently estimated at $550,902, approximately $363 per square foot. 451 E 620 S is a home located in Utah County with nearby schools including Foothills Elementary School, Valley View Middle School, and Salem Junior High School.
Ownership History
Date
Name
Owned For
Owner Type
Purchase Details
Closed on
Sep 14, 2021
Sold by
Patterson Mary
Bought by
Mary Kathryn Patterson Irrevocable Trust and Bunker
Current Estimated Value
Purchase Details
Closed on
Mar 14, 2003
Sold by
Patterson Michael Ray
Bought by
Patterson Michael Ray and Patterson Mary
Home Financials for this Owner
Home Financials are based on the most recent Mortgage that was taken out on this home.
Original Mortgage
$172,000
Interest Rate
5.82%
Purchase Details
Closed on
Jul 7, 1999
Sold by
Congdon Guy R and Congdon Melissa M
Bought by
Patterson Michael Ray
Home Financials for this Owner
Home Financials are based on the most recent Mortgage that was taken out on this home.
Original Mortgage
$166,000
Interest Rate
7.24%
Create a Home Valuation Report for This Property
The Home Valuation Report is an in-depth analysis detailing your home's value as well as a comparison with similar homes in the area
Home Values in the Area
Average Home Value in this Area
Purchase History
| Date | Buyer | Sale Price | Title Company |
|---|---|---|---|
| Mary Kathryn Patterson Irrevocable Trust | -- | None Listed On Document | |
| Patterson Michael Ray | -- | Inwest Title Services Inc | |
| Patterson Michael Ray | -- | Title West Title Co |
Source: Public Records
Mortgage History
| Date | Status | Borrower | Loan Amount |
|---|---|---|---|
| Previous Owner | Patterson Michael Ray | $172,000 | |
| Previous Owner | Patterson Michael Ray | $166,000 |
Source: Public Records
Tax History
| Year | Tax Paid | Tax Assessment Tax Assessment Total Assessment is a certain percentage of the fair market value that is determined by local assessors to be the total taxable value of land and additions on the property. | Land | Improvement |
|---|---|---|---|---|
| 2025 | $2,509 | $265,540 | -- | -- |
| 2024 | $2,509 | $254,485 | $0 | $0 |
| 2023 | $2,573 | $261,360 | $0 | $0 |
| 2022 | $2,510 | $251,075 | $0 | $0 |
| 2021 | $2,039 | $327,300 | $103,400 | $223,900 |
| 2020 | $1,954 | $305,200 | $94,000 | $211,200 |
| 2019 | $1,891 | $301,600 | $90,400 | $211,200 |
| 2018 | $1,813 | $276,400 | $79,600 | $196,800 |
| 2017 | $1,676 | $136,235 | $0 | $0 |
| 2016 | $1,417 | $113,905 | $0 | $0 |
| 2015 | $1,301 | $102,685 | $0 | $0 |
| 2014 | $1,299 | $102,685 | $0 | $0 |
Source: Public Records
Map
Nearby Homes
- 797 S 500 E Unit 12
- 243 E 960 S Unit 216
- 245 E 960 S Unit 215
- 247 E 960 S Unit 214
- 567 S Hazel Dr
- 1346 S 140 E Unit 10
- 1342 S 140 E Unit 11
- 412 S 100 E
- 1939 E Dorset Way Unit 306
- 1965 E Dorset Way Unit 303
- 1558 E 1010 N Unit 203
- 1984 E Dorset Way Unit 279
- 1802 E Albion Dr Unit 1142
- 1962 E Dorset Way Unit 276
- 1968 E Dorset Way Unit 277
- 881 E 820 S
- 9800 Woodland Hills Dr
- 180 Woodland Hills Dr
- 173 W 650 S Unit 10
- 1312 E 1020 S Unit 1
Your Personal Tour Guide
Ask me questions while you tour the home.