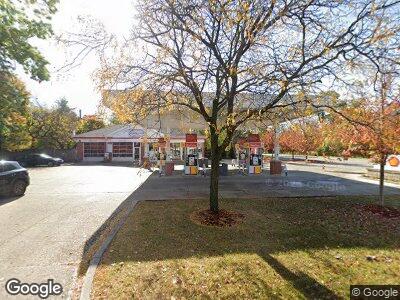
451 Glenview Rd Glenview, IL 60025
--
Bed
--
Bath
1,851
Sq Ft
0.28
Acres
About This Home
This home is located at 451 Glenview Rd, Glenview, IL 60025. 451 Glenview Rd is a home located in Cook County with nearby schools including Romona Elementary School, Highcrest Middle School, and Wilmette Junior High School.
Ownership History
Date
Name
Owned For
Owner Type
Purchase Details
Closed on
Feb 21, 2007
Sold by
North Star Trust Co
Bought by
Skop Properties Llc
Home Financials for this Owner
Home Financials are based on the most recent Mortgage that was taken out on this home.
Original Mortgage
$691,000
Interest Rate
7.38%
Mortgage Type
Commercial
Purchase Details
Closed on
May 9, 2003
Sold by
Hamswood Service Inc
Bought by
North Star Trust Co and Trust #03-6116
Home Financials for this Owner
Home Financials are based on the most recent Mortgage that was taken out on this home.
Original Mortgage
$585,000
Interest Rate
5.9%
Mortgage Type
Commercial
Purchase Details
Closed on
Nov 30, 2000
Sold by
Amoco Oil Company
Bought by
Harriswood Service Inc
Home Financials for this Owner
Home Financials are based on the most recent Mortgage that was taken out on this home.
Original Mortgage
$525,000
Interest Rate
7.7%
Mortgage Type
Commercial
Create a Home Valuation Report for This Property
The Home Valuation Report is an in-depth analysis detailing your home's value as well as a comparison with similar homes in the area
Home Values in the Area
Average Home Value in this Area
Purchase History
| Date | Buyer | Sale Price | Title Company |
|---|---|---|---|
| Skop Properties Llc | $880,000 | Cti | |
| North Star Trust Co | -- | -- | |
| Harriswood Service Inc | $188,000 | -- |
Source: Public Records
Mortgage History
| Date | Status | Borrower | Loan Amount |
|---|---|---|---|
| Closed | Skop Properties Llc | $975,000 | |
| Closed | Skop Properties Llc | $440,000 | |
| Closed | Skop Properties Llc | $720,000 | |
| Closed | Skop Properties Llc | $691,000 | |
| Previous Owner | North Star Trust Co | $585,000 | |
| Previous Owner | Harriswood Service Inc | $525,000 |
Source: Public Records
Tax History Compared to Growth
Tax History
| Year | Tax Paid | Tax Assessment Tax Assessment Total Assessment is a certain percentage of the fair market value that is determined by local assessors to be the total taxable value of land and additions on the property. | Land | Improvement |
|---|---|---|---|---|
| 2024 | $16,078 | $76,202 | $46,875 | $29,327 |
| 2023 | $16,078 | $76,202 | $46,875 | $29,327 |
| 2022 | $16,078 | $76,202 | $46,875 | $29,327 |
| 2021 | $17,033 | $67,411 | $46,875 | $20,536 |
| 2020 | $16,625 | $67,411 | $46,875 | $20,536 |
| 2019 | $14,770 | $67,411 | $46,875 | $20,536 |
| 2018 | $12,583 | $54,328 | $32,812 | $21,516 |
| 2017 | $12,170 | $54,328 | $32,812 | $21,516 |
| 2016 | $11,440 | $54,328 | $32,812 | $21,516 |
| 2015 | $12,342 | $51,411 | $25,312 | $26,099 |
| 2014 | $12,093 | $51,411 | $25,312 | $26,099 |
| 2013 | $18,681 | $83,046 | $25,312 | $57,734 |
Source: Public Records
Map
Nearby Homes
- 315 Glenview Rd
- 627 Beaver Rd
- 705 Hunter Rd
- 630 Juniper Rd
- 833 E Glenwood Rd
- 1115 Hunter Rd
- 48 Hackberry Ln
- 29 Glenview Rd
- 526 Laramie Ave
- 1237 Heatherfield Ln
- 1241 Sherwood Rd
- 3305 Old Glenview Rd Unit A
- 3227 Greenleaf Ave
- 3528 Forest Ave
- 10071 Frontage Rd Unit F
- 1125 Longvalley Rd
- 911 Club Cir
- 9725 Woods Dr Unit 507
- 9725 Woods Dr Unit 704
- 9725 Woods Dr Unit 506