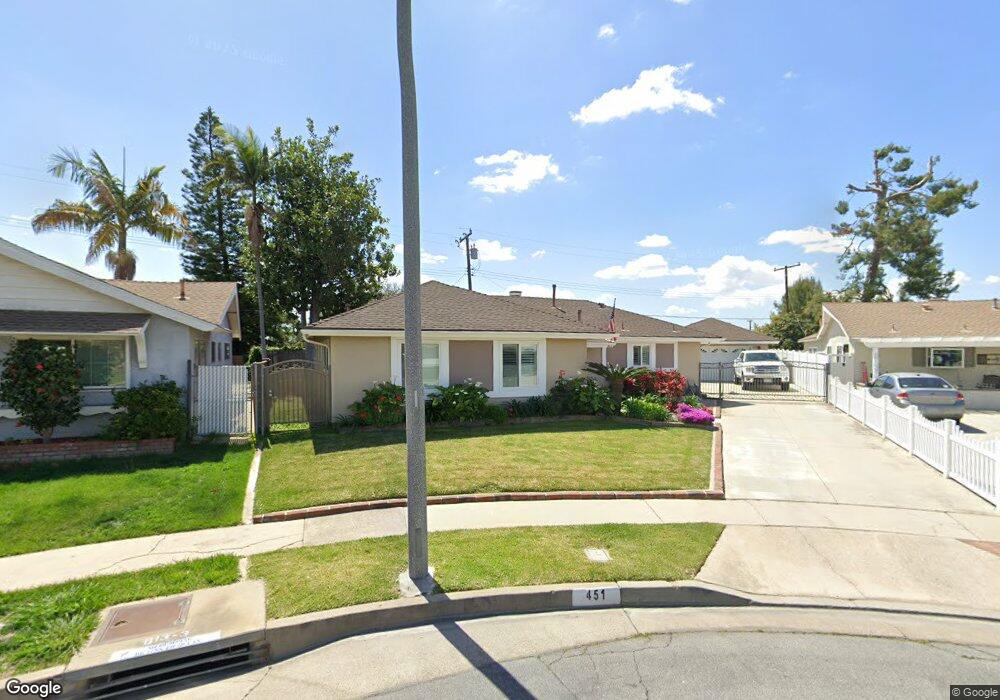
451 Palermo Way La Habra, CA 90631
Estimated Value: $849,000 - $889,000
4
Beds
2
Baths
1,281
Sq Ft
$679/Sq Ft
Est. Value
About This Home
This home is located at 451 Palermo Way, La Habra, CA 90631 and is currently estimated at $869,433, approximately $678 per square foot. 451 Palermo Way is a home located in Orange County with nearby schools including Sierra Vista Elementary School, Ladera Palma Elementary School, and Washington Middle School.
Ownership History
Date
Name
Owned For
Owner Type
Purchase Details
Closed on
Jun 4, 2013
Sold by
Vohn George
Bought by
Vohn George and Cygan Wendy
Current Estimated Value
Home Financials for this Owner
Home Financials are based on the most recent Mortgage that was taken out on this home.
Original Mortgage
$219,000
Outstanding Balance
$154,599
Interest Rate
3.32%
Mortgage Type
New Conventional
Estimated Equity
$714,834
Purchase Details
Closed on
Nov 4, 2002
Sold by
Pacheco Doreen and Vohn George
Bought by
Vohn George
Home Financials for this Owner
Home Financials are based on the most recent Mortgage that was taken out on this home.
Original Mortgage
$222,000
Interest Rate
5.95%
Purchase Details
Closed on
Oct 30, 1998
Sold by
Hertzberg John F and Hertzberg Annette Annette
Bought by
Pacheco Doreen and Vohn George
Home Financials for this Owner
Home Financials are based on the most recent Mortgage that was taken out on this home.
Original Mortgage
$188,344
Interest Rate
6.78%
Mortgage Type
FHA
Create a Home Valuation Report for This Property
The Home Valuation Report is an in-depth analysis detailing your home's value as well as a comparison with similar homes in the area
Home Values in the Area
Average Home Value in this Area
Purchase History
| Date | Buyer | Sale Price | Title Company |
|---|---|---|---|
| Vohn George | -- | Lsi Title Company | |
| Vohn George | -- | Lawyers Title Company | |
| Pacheco Doreen | $190,000 | Chicago Title Co |
Source: Public Records
Mortgage History
| Date | Status | Borrower | Loan Amount |
|---|---|---|---|
| Open | Vohn George | $219,000 | |
| Closed | Vohn George | $222,000 | |
| Closed | Pacheco Doreen | $188,344 |
Source: Public Records
Tax History Compared to Growth
Tax History
| Year | Tax Paid | Tax Assessment Tax Assessment Total Assessment is a certain percentage of the fair market value that is determined by local assessors to be the total taxable value of land and additions on the property. | Land | Improvement |
|---|---|---|---|---|
| 2025 | $3,487 | $297,696 | $215,497 | $82,199 |
| 2024 | $3,487 | $291,859 | $211,271 | $80,588 |
| 2023 | $3,404 | $286,137 | $207,129 | $79,008 |
| 2022 | $3,364 | $280,527 | $203,068 | $77,459 |
| 2021 | $3,309 | $275,027 | $199,086 | $75,941 |
| 2020 | $3,277 | $272,207 | $197,044 | $75,163 |
| 2019 | $3,188 | $266,870 | $193,180 | $73,690 |
| 2018 | $3,134 | $261,638 | $189,392 | $72,246 |
| 2017 | $3,078 | $256,508 | $185,678 | $70,830 |
| 2016 | $3,005 | $251,479 | $182,037 | $69,442 |
| 2015 | $2,920 | $247,702 | $179,303 | $68,399 |
| 2014 | $2,833 | $242,850 | $175,790 | $67,060 |
Source: Public Records
Map
Nearby Homes
- 1508 Mccart Ave
- 2211 Frantz Ave
- 1414 W Central Ave Unit 88
- 1223 El Encanto Dr
- 1261 Glen Lake Ave Unit 279
- 755 Village Lake Mall Unit 337
- 1506 Bergman Ct
- 1318 Alta Mesa Dr
- 1663 Gatewood Ct
- 410 N Fonda St
- 1341 Harbor Lake Ave Unit 24
- 686 Wood Lake Dr Unit 8
- 1936 Skywood St
- 1371 Pleasant Lake Place Unit 105
- 1400 Eastpark Dr
- 2201 Lake View Dr Unit 20
- 620 Lake Ridge Way Unit 45
- 224 S Fonda St
- 2121 Lake Side Dr Unit 158
- 551 Lake Grove Way Unit 165
- 461 Palermo Way
- 450 Palermo Way
- 2301 Walling Ave
- 2311 Walling Ave
- 2251 Walling Ave
- 2321 Walling Ave
- 471 Palermo Way
- 460 Palermo Way
- 470 Palermo Way
- 460 Verona St
- 2241 Walling Ave
- 470 Verona St
- 481 Palermo Way
- 480 Palermo Way
- 1011 Delay St
- 1005 Delay St
- 1015 Delay St
- 480 Verona St
- 450 Verona St
- 501 Palermo Way