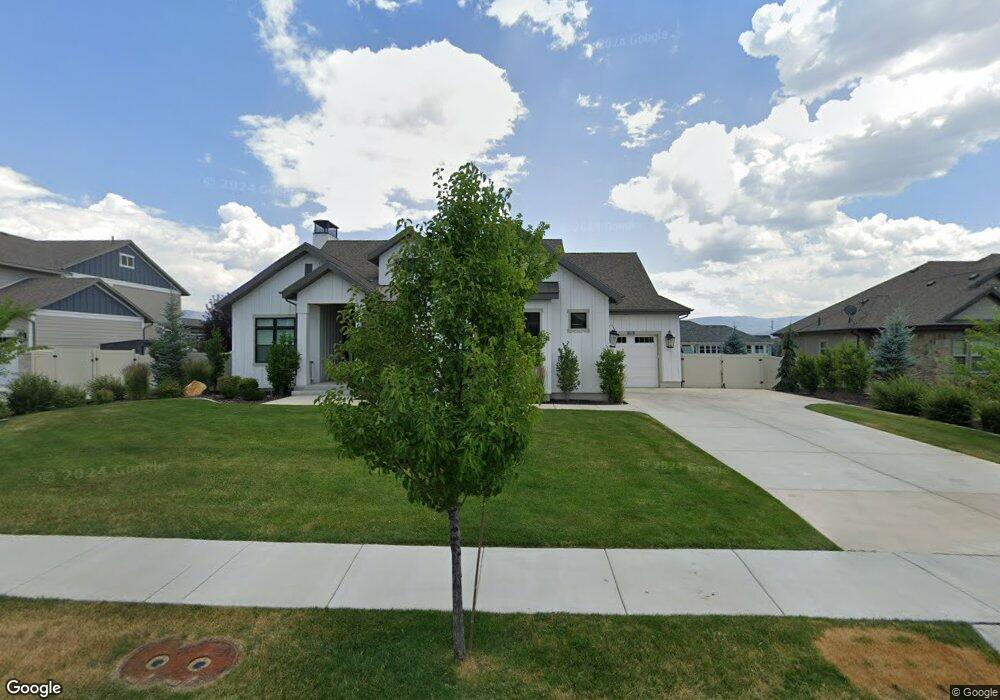
451 S 300 E Unit 9 Midway, UT 84049
Estimated Value: $1,370,000 - $2,002,709
Studio
--
Bath
2,766
Sq Ft
$626/Sq Ft
Est. Value
About This Home
This home is located at 451 S 300 E Unit 9, Midway, UT 84049 and is currently estimated at $1,731,677, approximately $626 per square foot. 451 S 300 E Unit 9 is a home located in Wasatch County with nearby schools including Midway Elementary School, Rocky Mountain Middle School, and Wasatch High School.
Ownership History
Date
Name
Owned For
Owner Type
Purchase Details
Closed on
Aug 19, 2021
Sold by
Bowen Ashley Ann and Bowen Erin James
Bought by
Reeve James N and Reeve Suzanne M
Current Estimated Value
Home Financials for this Owner
Home Financials are based on the most recent Mortgage that was taken out on this home.
Original Mortgage
$1,062,000
Outstanding Balance
$964,232
Interest Rate
2.8%
Mortgage Type
New Conventional
Estimated Equity
$767,445
Purchase Details
Closed on
May 20, 2019
Sold by
Ivory Homes Ltd
Bought by
Bowen Ashley Ann and Bowen Erin James
Home Financials for this Owner
Home Financials are based on the most recent Mortgage that was taken out on this home.
Original Mortgage
$780,000
Interest Rate
4%
Mortgage Type
New Conventional
Purchase Details
Closed on
Jan 8, 2018
Sold by
Deer Creek Estates Llc
Bought by
Merchant Samer
Create a Home Valuation Report for This Property
The Home Valuation Report is an in-depth analysis detailing your home's value as well as a comparison with similar homes in the area
Home Values in the Area
Average Home Value in this Area
Purchase History
| Date | Buyer | Sale Price | Title Company |
|---|---|---|---|
| Reeve James N | -- | Atlas Title Heber City | |
| Bowen Ashley Ann | -- | Cottonwood Title Ins Agcy | |
| Ivory Homes Ltd | -- | Cottonwood Title Ins Agcy | |
| Merchant Samer | -- | American Secure Title Logan |
Source: Public Records
Mortgage History
| Date | Status | Borrower | Loan Amount |
|---|---|---|---|
| Open | Reeve James N | $1,062,000 | |
| Previous Owner | Bowen Ashley Ann | $780,000 |
Source: Public Records
Tax History
| Year | Tax Paid | Tax Assessment Tax Assessment Total Assessment is a certain percentage of the fair market value that is determined by local assessors to be the total taxable value of land and additions on the property. | Land | Improvement |
|---|---|---|---|---|
| 2025 | $11,538 | $1,252,140 | $450,000 | $802,140 |
| 2024 | $10,721 | $1,176,600 | $450,000 | $726,600 |
| 2023 | $10,721 | $1,342,676 | $275,000 | $1,067,676 |
| 2022 | $7,405 | $1,342,676 | $275,000 | $1,067,676 |
| 2021 | $6,680 | $935,995 | $180,000 | $755,995 |
| 2020 | $6,889 | $935,995 | $180,000 | $755,995 |
| 2019 | $2,203 | $180,000 | $0 | $0 |
| 2018 | $2,203 | $180,000 | $0 | $0 |
| 2017 | $0 | $0 | $0 | $0 |
Source: Public Records
Map
Nearby Homes
- 618 S Fox Den Rd
- 618 S Fox Den Rd Unit 2
- 215 S 300 E
- 141 S 180 E
- 53 W 300 S
- 115 S 100 E
- 115 S 100 E Unit 4
- 694 E 260 S
- 693 S Appenzell Ln
- 832 E Michie Ln
- 55 S Center St
- 103 E Main St
- 780 E Hamlet Cir S
- 85 N 100 E
- 70 Geneva Dr
- 71 S 200 W
- 863 Zurich Ln
- 902 E Hamlet Cir S
- 890 E Hamlet Cir N
- 890 E Hamlet Cir N Unit N
- 451 S 300 E
- 446 S 300 E Unit 16
- 435 S 300 E Unit 8
- 435 S 300 E
- 465 S 300 E Unit 10
- 465 S 300 E
- 428 S 300 E
- 428 S 300 E Unit 17
- 468 S 300 E Unit 15
- 466 S 300 E
- 412 S 300 E Unit 18
- 483 S 300 E E Unit 38555393
- 483 S 300 E Unit 11
- 483 S 300 E
- 483 S 300 E
- 417 S 300 E
- 417 S 300 E Unit 7
- 417 S 300 E
- 486 S 300 E Unit 14
- 460 S 360 E
Your Personal Tour Guide
Ask me questions while you tour the home.