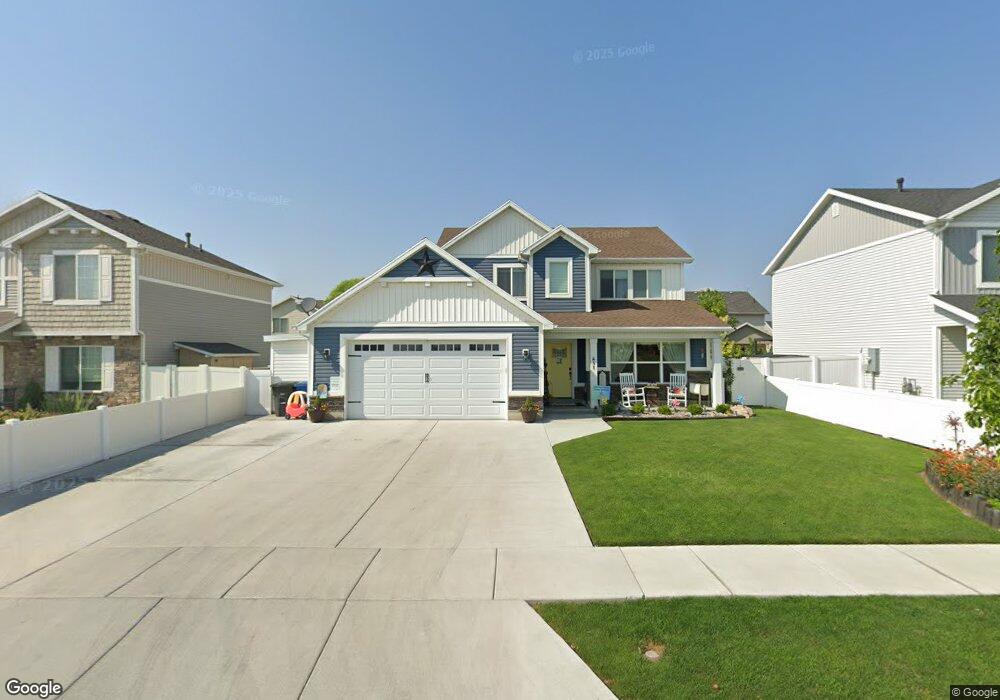
451 W 1110 N Logan, UT 84341
Bridger NeighborhoodEstimated Value: $425,000 - $550,000
Studio
--
Bath
2,236
Sq Ft
$206/Sq Ft
Est. Value
About This Home
This home is located at 451 W 1110 N, Logan, UT 84341 and is currently estimated at $460,670, approximately $206 per square foot. 451 W 1110 N is a home with nearby schools including Bridger School, Mount Logan Middle School, and Logan High School.
Ownership History
Date
Name
Owned For
Owner Type
Purchase Details
Closed on
Sep 28, 2018
Sold by
Stockhoff Deeann and Hebdon Kenneth Dee
Bought by
Stockhoff Deann
Current Estimated Value
Home Financials for this Owner
Home Financials are based on the most recent Mortgage that was taken out on this home.
Original Mortgage
$191,000
Outstanding Balance
$165,876
Interest Rate
4.5%
Mortgage Type
New Conventional
Estimated Equity
$294,794
Purchase Details
Closed on
Apr 12, 2018
Sold by
Visionary Homes 2018 Llc
Bought by
Dee Stockhott Deeann and Dee Heedon Kenneth
Purchase Details
Closed on
Apr 11, 2018
Sold by
Terraco Holdings Llc
Bought by
Visionary Homes 2018 Llc
Purchase Details
Closed on
Apr 10, 2018
Sold by
Johnson Wesley D
Bought by
Visionary Homes 2018 Llc
Purchase Details
Closed on
Aug 20, 2015
Sold by
Legrand Johnson Construction Co
Bought by
Ljcc Reserve Llc
Create a Home Valuation Report for This Property
The Home Valuation Report is an in-depth analysis detailing your home's value as well as a comparison with similar homes in the area
Home Values in the Area
Average Home Value in this Area
Purchase History
| Date | Buyer | Sale Price | Title Company |
|---|---|---|---|
| Stockhoff Deann | -- | Pinnacle Title | |
| Dee Stockhott Deeann | -- | Cache Title Co | |
| Visionary Homes 2018 Llc | -- | Hickman Land Title | |
| Visionary Homes 2018 Llc | -- | Hickman Land Title | |
| Visionary Homes 2018 Llc | -- | Hickman Land Title | |
| Ljcc Reserve Llc | -- | First American Title Ins Co |
Source: Public Records
Mortgage History
| Date | Status | Borrower | Loan Amount |
|---|---|---|---|
| Open | Stockhoff Deann | $191,000 |
Source: Public Records
Tax History
| Year | Tax Paid | Tax Assessment Tax Assessment Total Assessment is a certain percentage of the fair market value that is determined by local assessors to be the total taxable value of land and additions on the property. | Land | Improvement |
|---|---|---|---|---|
| 2025 | $1,899 | $245,575 | $0 | $0 |
| 2024 | $1,960 | $245,575 | $0 | $0 |
| 2023 | $2,049 | $244,695 | $0 | $0 |
| 2022 | $2,195 | $244,695 | $0 | $0 |
| 2021 | $1,765 | $304,085 | $42,000 | $262,085 |
| 2020 | $1,741 | $269,900 | $42,000 | $227,900 |
| 2019 | $1,820 | $269,900 | $42,000 | $227,900 |
| 2018 | $564 | $42,000 | $42,000 | $0 |
| 2017 | $587 | $42,000 | $0 | $0 |
| 2016 | $608 | $32,000 | $0 | $0 |
| 2015 | $464 | $32,000 | $0 | $0 |
| 2014 | $419 | $32,000 | $0 | $0 |
| 2013 | -- | $32,000 | $0 | $0 |
Source: Public Records
Map
Nearby Homes
Your Personal Tour Guide
Ask me questions while you tour the home.