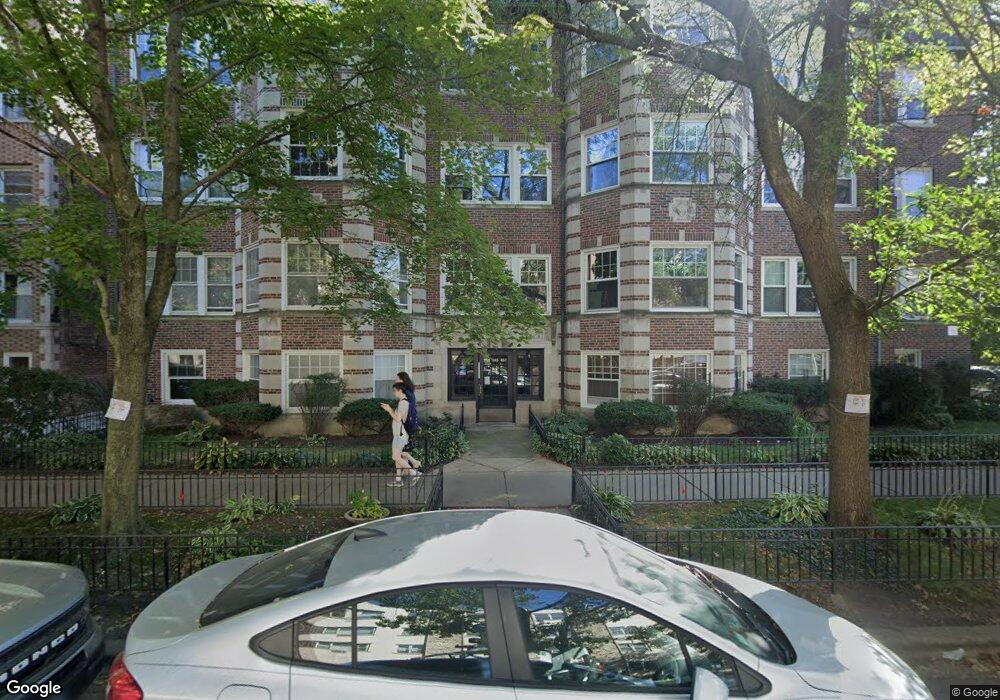
451 W Oakdale Ave Unit 4512 Chicago, IL 60657
Lakeview East NeighborhoodEstimated Value: $528,023 - $659,000
--
Bed
--
Bath
--
Sq Ft
0.27
Acres
About This Home
This home is located at 451 W Oakdale Ave Unit 4512, Chicago, IL 60657 and is currently estimated at $593,006. 451 W Oakdale Ave Unit 4512 is a home located in Cook County with nearby schools including Nettelhorst Elementary School, Lake View High School, and Our Lady Of Mount Carmel Academy.
Ownership History
Date
Name
Owned For
Owner Type
Purchase Details
Closed on
Aug 6, 2009
Sold by
Swartz Gregory Marshall Morell and Schwartz Gregory M
Bought by
Swartz Gregory M and Swartz Aimee
Current Estimated Value
Home Financials for this Owner
Home Financials are based on the most recent Mortgage that was taken out on this home.
Original Mortgage
$388,000
Outstanding Balance
$243,661
Interest Rate
4.5%
Mortgage Type
New Conventional
Estimated Equity
$349,345
Purchase Details
Closed on
May 19, 1999
Sold by
Benjamin J Kevin
Bought by
Chicago Title Land Trust Company and Trust #1102904
Purchase Details
Closed on
Feb 15, 1999
Sold by
Chicago Title Land Trust Company
Bought by
Benjamin J Kevin
Home Financials for this Owner
Home Financials are based on the most recent Mortgage that was taken out on this home.
Original Mortgage
$185,000
Interest Rate
6.83%
Create a Home Valuation Report for This Property
The Home Valuation Report is an in-depth analysis detailing your home's value as well as a comparison with similar homes in the area
Home Values in the Area
Average Home Value in this Area
Purchase History
| Date | Buyer | Sale Price | Title Company |
|---|---|---|---|
| Swartz Gregory M | -- | Stewart Title Company | |
| Chicago Title Land Trust Company | -- | -- | |
| Benjamin J Kevin | -- | 1St American Title |
Source: Public Records
Mortgage History
| Date | Status | Borrower | Loan Amount |
|---|---|---|---|
| Open | Swartz Gregory M | $388,000 | |
| Previous Owner | Benjamin J Kevin | $185,000 |
Source: Public Records
Tax History Compared to Growth
Tax History
| Year | Tax Paid | Tax Assessment Tax Assessment Total Assessment is a certain percentage of the fair market value that is determined by local assessors to be the total taxable value of land and additions on the property. | Land | Improvement |
|---|---|---|---|---|
| 2024 | $8,162 | $49,924 | $9,271 | $40,653 |
| 2023 | $7,935 | $42,000 | $7,477 | $34,523 |
| 2022 | $7,935 | $42,000 | $7,477 | $34,523 |
| 2021 | $7,776 | $42,000 | $7,477 | $34,523 |
| 2020 | $8,319 | $40,445 | $4,934 | $35,511 |
| 2019 | $8,211 | $44,296 | $4,934 | $39,362 |
| 2018 | $8,071 | $44,296 | $4,934 | $39,362 |
| 2017 | $8,767 | $44,102 | $4,336 | $39,766 |
| 2016 | $8,333 | $44,102 | $4,336 | $39,766 |
| 2015 | $7,601 | $44,102 | $4,336 | $39,766 |
| 2014 | $6,206 | $36,016 | $3,551 | $32,465 |
| 2013 | $6,072 | $36,016 | $3,551 | $32,465 |
Source: Public Records
Map
Nearby Homes
- 2946 N Pine Grove Ave Unit 1S
- 431 W Oakdale Ave Unit 14C
- 431 W Oakdale Ave Unit 11A
- 431 W Oakdale Ave Unit 10D
- 2930 N Sheridan Rd Unit 2111
- 435 W Surf St Unit 4A
- 415 W Surf St
- 550 W Surf St Unit 115
- 550 W Surf St Unit 316
- 2909 N Sheridan Rd Unit 908
- 2909 N Sheridan Rd Unit 1105
- 2800 N Pine Grove Ave Unit 8A
- 320 W Oakdale Ave Unit 801
- 3033 N Sheridan Rd Unit 1604
- 3033 N Sheridan Rd Unit 307
- 3033 N Sheridan Rd Unit 602
- 500 W Barry Ave Unit 2E
- 2773 N Hampden Ct Unit 401
- 2773 N Hampden Ct Unit PH03
- 3100 N Sheridan Rd Unit 11D
- 2931 N Pine Grove Ave Unit PU1
- 451 W Oakdale Ave Unit 451FOYE
- 2931 N Pine Grove Ave Unit 2931
- 2931 N Pine Grove Ave Unit 2931
- 451 W Oakdale Ave Unit 4513
- 2931 N Pine Grove Ave Unit PU3
- 2931 N Pine Grove Ave Unit 2931
- 2931 N Pine Grove Ave Unit PU2
- 451 W Oakdale Ave Unit 4511
- 2931 N Pine Grove Ave Unit 1
- 2931 N Pine Grove Ave Unit 3
- 451 W Oakdale Ave Unit 3
- 2935 N Pine Grove Ave Unit 2G
- 2929 N Pine Grove Ave Unit 2929
- 2929 N Pine Grove Ave Unit 2929
- 2929 N Pine Grove Ave Unit 2929
- 2929 N Pine Grove Ave Unit 3
- 447 W Oakdale Ave
- 447 W Oakdale Ave Unit 1
- 2925 N Pine Grove Ave Unit 1