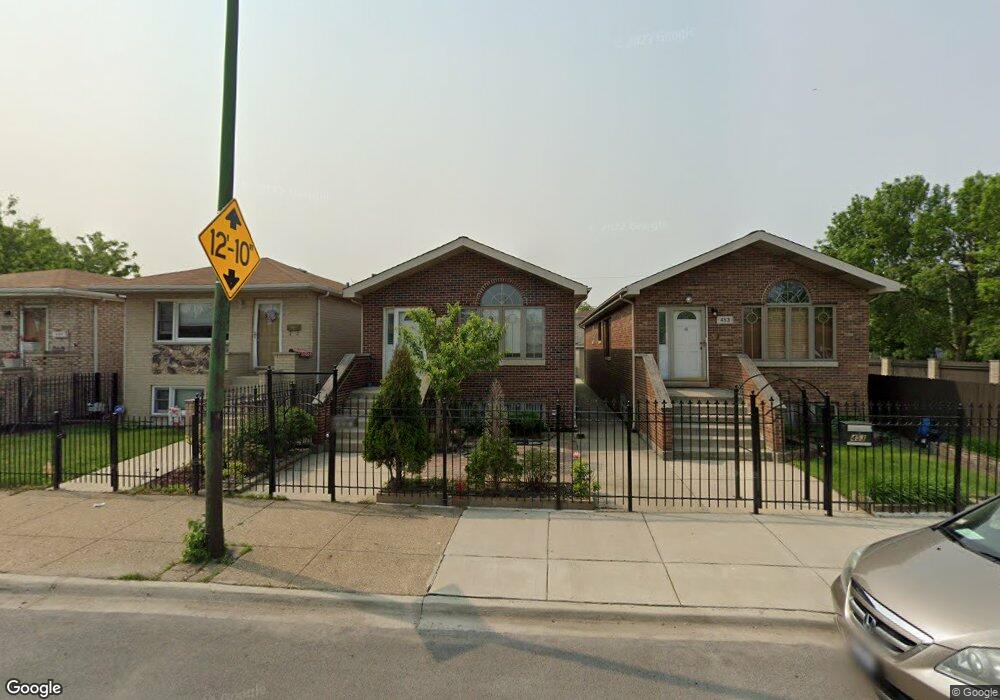
451 W Root St Chicago, IL 60609
Bridgeport NeighborhoodEstimated Value: $382,000 - $579,000
3
Beds
2
Baths
1,152
Sq Ft
$411/Sq Ft
Est. Value
About This Home
This home is located at 451 W Root St, Chicago, IL 60609 and is currently estimated at $473,809, approximately $411 per square foot. 451 W Root St is a home located in Cook County with nearby schools including Hendricks Elementary Community Academy, St Gabriel Elementary School, and Bridgeport Catholic Academy - South Campus.
Ownership History
Date
Name
Owned For
Owner Type
Purchase Details
Closed on
Jan 5, 2005
Sold by
Cicinelli Tom and Dickman Walter
Bought by
Li Dong Hui and Chan Ling Kuong
Current Estimated Value
Home Financials for this Owner
Home Financials are based on the most recent Mortgage that was taken out on this home.
Original Mortgage
$248,800
Outstanding Balance
$115,727
Interest Rate
4.87%
Mortgage Type
Unknown
Estimated Equity
$358,082
Purchase Details
Closed on
Aug 21, 2003
Sold by
Ruano Karen and Aguilar Todd
Bought by
Cicinelli Tom and Dickman Walter
Home Financials for this Owner
Home Financials are based on the most recent Mortgage that was taken out on this home.
Original Mortgage
$175,000
Interest Rate
6.75%
Mortgage Type
Unknown
Create a Home Valuation Report for This Property
The Home Valuation Report is an in-depth analysis detailing your home's value as well as a comparison with similar homes in the area
Home Values in the Area
Average Home Value in this Area
Purchase History
We collect this data history from publicly available records. To have your information removed, we recommend requesting removal directly through your county’s website.
| Date | Buyer | Sale Price | Title Company |
|---|---|---|---|
| Li Dong Hui | $316,000 | First American Title | |
| Cicinelli Tom | $175,000 | Cst |
Source: Public Records
Mortgage History
We collect this data history from publicly available records. To have your information removed, we recommend requesting removal directly through your county’s website.
| Date | Status | Borrower | Loan Amount |
|---|---|---|---|
| Open | Li Dong Hui | $248,800 | |
| Previous Owner | Cicinelli Tom | $175,000 |
Source: Public Records
Tax History
| Year | Tax Paid | Tax Assessment Tax Assessment Total Assessment is a certain percentage of the fair market value that is determined by local assessors to be the total taxable value of land and additions on the property. | Land | Improvement |
|---|---|---|---|---|
| 2025 | $5,231 | $33,000 | $2,480 | $30,520 |
| 2024 | $5,231 | $33,000 | $2,480 | $30,520 |
| 2023 | $5,060 | $30,760 | $3,100 | $27,660 |
| 2022 | $5,060 | $30,760 | $3,100 | $27,660 |
| 2021 | $5,229 | $32,000 | $3,100 | $28,900 |
| 2020 | $3,277 | $20,293 | $3,100 | $17,193 |
| 2019 | $3,841 | $22,548 | $3,100 | $19,448 |
| 2018 | $3,775 | $22,548 | $3,100 | $19,448 |
| 2017 | $4,232 | $23,033 | $2,790 | $20,243 |
| 2016 | $4,113 | $23,033 | $2,790 | $20,243 |
| 2015 | $3,740 | $23,033 | $2,790 | $20,243 |
| 2014 | $3,860 | $23,371 | $2,635 | $20,736 |
| 2013 | $3,772 | $23,371 | $2,635 | $20,736 |
Source: Public Records
Map
Nearby Homes
- 500 W 42nd St
- 422 W 42nd Place
- 4135 S Wallace St
- 4178 S Wallace St
- 4206 S Wells St
- 4250 S Wells St
- 245 W 43rd St
- 4204 S Wentworth Ave
- 5131 S Union Ave
- 4166 S Emerald Ave
- 4338 S Wells St
- 3938 S Wells St Unit 2
- 4418 S Wallace St
- 3841 S Lowe Ave
- 511 W 45th St
- 516 W 45th Place
- 3748 S Parnell Ave
- 4505 S Union Ave
- 4500 S Wells St
- 3749 S Union Ave
Your Personal Tour Guide
Ask me questions while you tour the home.