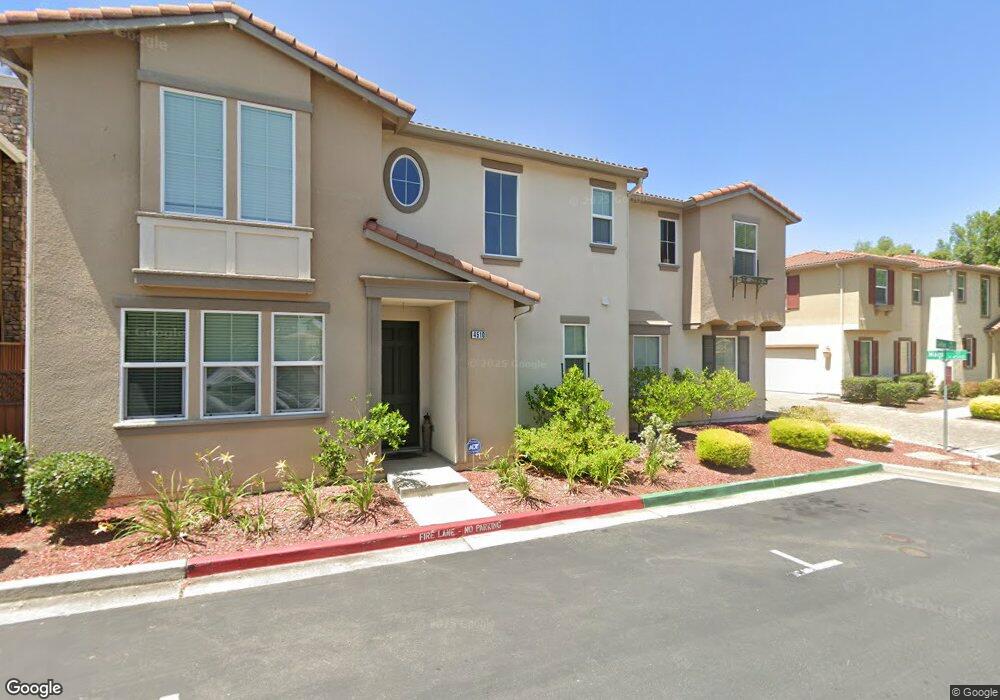
4510 Magi Ct Antioch, CA 94509
Deer Valley NeighborhoodEstimated Value: $599,318 - $643,000
3
Beds
3
Baths
2,193
Sq Ft
$283/Sq Ft
Est. Value
About This Home
This home is located at 4510 Magi Ct, Antioch, CA 94509 and is currently estimated at $621,330, approximately $283 per square foot. 4510 Magi Ct is a home located in Contra Costa County with nearby schools including John Muir Elementary School, Dallas Ranch Middle School, and Deer Valley High School.
Ownership History
Date
Name
Owned For
Owner Type
Purchase Details
Closed on
Sep 5, 2008
Sold by
Kb Home South Bay Inc
Bought by
Nobriga Revelia
Current Estimated Value
Home Financials for this Owner
Home Financials are based on the most recent Mortgage that was taken out on this home.
Original Mortgage
$274,500
Outstanding Balance
$181,747
Interest Rate
6.51%
Mortgage Type
Purchase Money Mortgage
Estimated Equity
$439,583
Purchase Details
Closed on
Mar 13, 2008
Sold by
Kaufman Capital Llc
Bought by
Kb Home South Bay Inc
Create a Home Valuation Report for This Property
The Home Valuation Report is an in-depth analysis detailing your home's value as well as a comparison with similar homes in the area
Home Values in the Area
Average Home Value in this Area
Purchase History
| Date | Buyer | Sale Price | Title Company |
|---|---|---|---|
| Nobriga Revelia | $305,000 | First American Title Company | |
| Kb Home South Bay Inc | -- | First American Title Company |
Source: Public Records
Mortgage History
| Date | Status | Borrower | Loan Amount |
|---|---|---|---|
| Open | Nobriga Revelia | $274,500 |
Source: Public Records
Tax History
| Year | Tax Paid | Tax Assessment Tax Assessment Total Assessment is a certain percentage of the fair market value that is determined by local assessors to be the total taxable value of land and additions on the property. | Land | Improvement |
|---|---|---|---|---|
| 2025 | $4,691 | $392,750 | $25,745 | $367,005 |
| 2024 | $4,575 | $385,050 | $25,241 | $359,809 |
| 2023 | $4,407 | $377,501 | $24,747 | $352,754 |
| 2022 | $4,339 | $370,100 | $24,262 | $345,838 |
| 2021 | $4,135 | $362,844 | $23,787 | $339,057 |
| 2019 | $4,036 | $352,084 | $23,083 | $329,001 |
| 2018 | $3,879 | $345,181 | $22,631 | $322,550 |
| 2017 | $3,795 | $338,414 | $22,188 | $316,226 |
| 2016 | $3,698 | $331,779 | $21,753 | $310,026 |
| 2015 | $3,956 | $326,797 | $21,427 | $305,370 |
| 2014 | $4,903 | $320,397 | $21,008 | $299,389 |
Source: Public Records
Map
Nearby Homes
- 3508 Alberti Ct
- 3504 Alberti Ct
- 318 Redrock Dr
- 4729 Matterhorn Ct
- 3937 Pebble Dr
- 224 Cobblestone Dr
- 4109 S Royal Links Cir
- 4722 Cache Peak Dr
- 4737 Crestone Peak Ct
- 3613 Longview Rd
- 26 El Capitan Ln
- 14 El Capitan Ln
- 4836 Belford Peak Way
- 9 El Capitan Ln
- 108 Fleetwood Dr
- 924 Flintrock Dr
- 2076 Catalpa Way
- 941 Bluerock Dr
- 5 Terranova Dr
- 3405 Garrow Dr
Your Personal Tour Guide
Ask me questions while you tour the home.