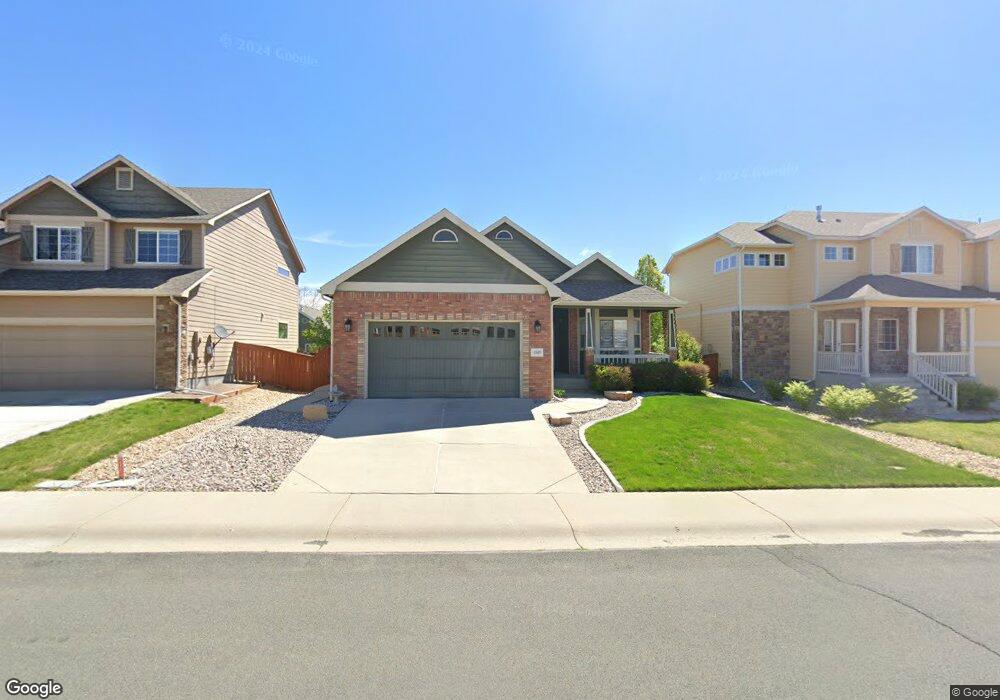
4510 Ridgway Dr Loveland, CO 80538
Estimated Value: $581,257 - $728,000
3
Beds
2
Baths
1,565
Sq Ft
$410/Sq Ft
Est. Value
About This Home
This home is located at 4510 Ridgway Dr, Loveland, CO 80538 and is currently estimated at $641,064, approximately $409 per square foot. 4510 Ridgway Dr is a home located in Larimer County with nearby schools including Centennial Elementary School, Lucile Erwin Middle School, and Loveland High School.
Ownership History
Date
Name
Owned For
Owner Type
Purchase Details
Closed on
Feb 8, 2021
Sold by
Newhouse Marlene
Bought by
Williams Marlene
Current Estimated Value
Purchase Details
Closed on
Oct 23, 2017
Sold by
Newhorse John E
Bought by
Newhoke Marlene
Purchase Details
Closed on
Feb 19, 2015
Sold by
Williams Marlene and Newhouse Marlene
Bought by
Newhouse Marlene and Newhouse John E
Purchase Details
Closed on
Mar 21, 2006
Sold by
Triton Homes Inc
Bought by
Williams Lawrence and Williams Marlene
Home Financials for this Owner
Home Financials are based on the most recent Mortgage that was taken out on this home.
Original Mortgage
$228,000
Interest Rate
6.21%
Mortgage Type
Fannie Mae Freddie Mac
Purchase Details
Closed on
Sep 6, 2005
Sold by
R & R Homes Of Northern Colorado Inc
Bought by
Triton Homes Inc
Create a Home Valuation Report for This Property
The Home Valuation Report is an in-depth analysis detailing your home's value as well as a comparison with similar homes in the area
Home Values in the Area
Average Home Value in this Area
Purchase History
| Date | Buyer | Sale Price | Title Company |
|---|---|---|---|
| Williams Marlene | -- | None Available | |
| Newhoke Marlene | -- | None Available | |
| Newhouse Marlene | -- | None Available | |
| Williams Lawrence | $285,000 | None Available | |
| Triton Homes Inc | -- | Security Title |
Source: Public Records
Mortgage History
| Date | Status | Borrower | Loan Amount |
|---|---|---|---|
| Previous Owner | Williams Lawrence | $228,000 |
Source: Public Records
Tax History Compared to Growth
Tax History
| Year | Tax Paid | Tax Assessment Tax Assessment Total Assessment is a certain percentage of the fair market value that is determined by local assessors to be the total taxable value of land and additions on the property. | Land | Improvement |
|---|---|---|---|---|
| 2025 | $3,064 | $42,083 | $10,720 | $31,363 |
| 2024 | $2,955 | $42,083 | $10,720 | $31,363 |
| 2022 | $2,547 | $32,005 | $6,950 | $25,055 |
| 2021 | $2,617 | $32,926 | $7,150 | $25,776 |
| 2020 | $2,465 | $31,002 | $7,150 | $23,852 |
| 2019 | $2,423 | $31,002 | $7,150 | $23,852 |
| 2018 | $2,453 | $29,808 | $7,200 | $22,608 |
| 2017 | $2,113 | $29,808 | $7,200 | $22,608 |
| 2016 | $1,711 | $23,331 | $5,413 | $17,918 |
| 2015 | $1,697 | $23,330 | $5,410 | $17,920 |
| 2014 | -- | $22,460 | $4,300 | $18,160 |
Source: Public Records
Map
Nearby Homes
- 2015 Massachusetts St
- 4559 Keota Place
- 2250 W 44th St
- 2070 Tonopas Ct
- 1905 Massachusetts St
- 2050 Alabama St
- 1734 W 50th St
- 2308 Winter Park St
- 2349 Paonia St
- 1844 W 50th St
- 2554 W 44th St
- 2597 W 46th St
- 4715 Wisconsin Ave
- 5001 Avon Ave
- 1555 Oak Creek Dr
- 5042 Stonewall St
- 2643 W 45th St
- Zion Plan at Eagle Brook Meadows
- 5037 Avon Ave
- Acadia Plan at Eagle Brook Meadows
- 4490 Ridgway Dr
- 4520 Ridgway Dr
- 4515 Wolcott Dr
- 4480 Ridgway Dr
- 4495 Wolcott Dr
- 4525 Wolcott Dr
- 4515 Ridgway Dr
- 4485 Wolcott Dr
- 4495 Ridgway Dr
- 4470 Ridgway Dr
- 4525 Ridgway Dr
- 4485 Ridgway Dr
- 4560 Ridgway Dr
- 4475 Wolcott Dr
- 4565 Wolcott Dr
- 4460 Ridgway Dr
- 4475 Ridgway Dr
- 4565 Ridgway Dr
- 4465 Wolcott Dr
- 4590 Ridgway Dr