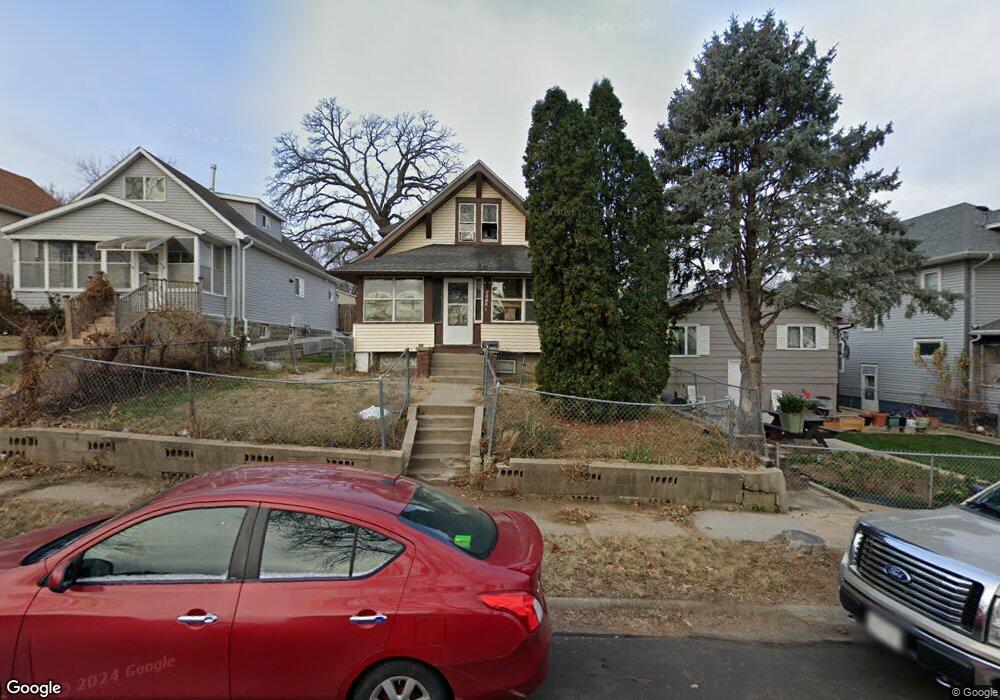
4510 S 18th St Omaha, NE 68107
South Central Omaha NeighborhoodEstimated Value: $157,000 - $187,000
2
Beds
1
Bath
1,236
Sq Ft
$137/Sq Ft
Est. Value
About This Home
This home is located at 4510 S 18th St, Omaha, NE 68107 and is currently estimated at $169,099, approximately $136 per square foot. 4510 S 18th St is a home located in Douglas County with nearby schools including Gomez Heritage Elementary School, R.M. Marrs Magnet Middle School, and South High Magnet School.
Ownership History
Date
Name
Owned For
Owner Type
Purchase Details
Closed on
Jan 28, 2021
Sold by
James Adolfo and Accredited Home Lenders Inc
Bought by
Palencia Hilda Lorena
Current Estimated Value
Purchase Details
Closed on
Jan 3, 2020
Sold by
Junes Adolfo
Bought by
Park Tree Invstments 21 Llc
Purchase Details
Closed on
Oct 8, 2016
Sold by
Junes Adolfoz
Bought by
Rio Guadalupe
Create a Home Valuation Report for This Property
The Home Valuation Report is an in-depth analysis detailing your home's value as well as a comparison with similar homes in the area
Home Values in the Area
Average Home Value in this Area
Purchase History
| Date | Buyer | Sale Price | Title Company |
|---|---|---|---|
| Palencia Hilda Lorena | $75,000 | None Available | |
| Park Tree Invstments 21 Llc | $38,245 | None Available | |
| Rio Guadalupe | -- | None Available |
Source: Public Records
Tax History
| Year | Tax Paid | Tax Assessment Tax Assessment Total Assessment is a certain percentage of the fair market value that is determined by local assessors to be the total taxable value of land and additions on the property. | Land | Improvement |
|---|---|---|---|---|
| 2025 | $2,388 | $143,600 | $14,500 | $129,100 |
| 2024 | $2,561 | $143,600 | $14,500 | $129,100 |
| 2023 | $2,561 | $121,400 | $14,500 | $106,900 |
| 2022 | $2,562 | $120,000 | $13,100 | $106,900 |
| 2021 | $2,165 | $102,300 | $13,100 | $89,200 |
| 2020 | $1,940 | $90,600 | $6,900 | $83,700 |
| 2019 | $1,664 | $77,500 | $5,800 | $71,700 |
| 2018 | $1,475 | $68,600 | $5,800 | $62,800 |
| 2016 | $1,472 | $68,600 | $5,800 | $62,800 |
Source: Public Records
Map
Nearby Homes
Your Personal Tour Guide
Ask me questions while you tour the home.