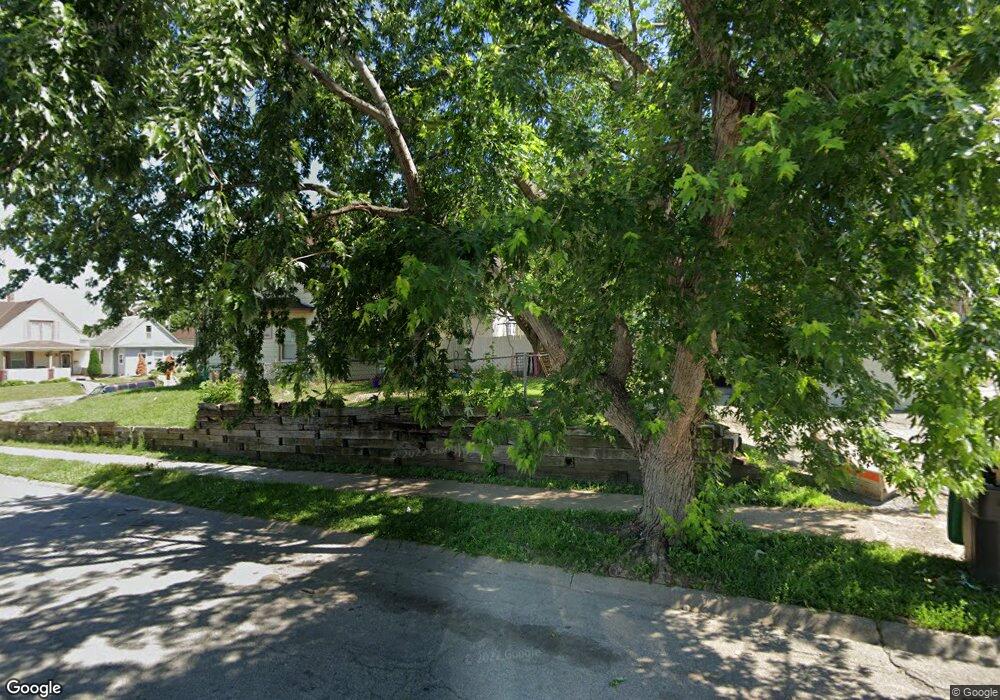
4510 S 19th St Omaha, NE 68107
South Central Omaha NeighborhoodEstimated Value: $189,000 - $223,000
3
Beds
2
Baths
1,512
Sq Ft
$132/Sq Ft
Est. Value
About This Home
This home is located at 4510 S 19th St, Omaha, NE 68107 and is currently estimated at $199,246, approximately $131 per square foot. 4510 S 19th St is a home located in Douglas County with nearby schools including Gomez Heritage Elementary School, R.M. Marrs Magnet Middle School, and South High School.
Ownership History
Date
Name
Owned For
Owner Type
Purchase Details
Closed on
Oct 24, 2023
Sold by
Clark Marie A and Clark Jerome
Bought by
Lm & F Investments Llc
Current Estimated Value
Purchase Details
Closed on
Jun 3, 2010
Sold by
Clark Marie A and Clark Jerome
Bought by
Clark Marie A and Clark Jerome
Home Financials for this Owner
Home Financials are based on the most recent Mortgage that was taken out on this home.
Original Mortgage
$86,400
Interest Rate
5.02%
Mortgage Type
New Conventional
Create a Home Valuation Report for This Property
The Home Valuation Report is an in-depth analysis detailing your home's value as well as a comparison with similar homes in the area
Home Values in the Area
Average Home Value in this Area
Purchase History
| Date | Buyer | Sale Price | Title Company |
|---|---|---|---|
| Lm & F Investments Llc | $150,000 | Nebraska Title | |
| Clark Marie A | -- | Dakota Title & Escrow Co |
Source: Public Records
Mortgage History
| Date | Status | Borrower | Loan Amount |
|---|---|---|---|
| Previous Owner | Clark Marie A | $86,400 |
Source: Public Records
Tax History Compared to Growth
Tax History
| Year | Tax Paid | Tax Assessment Tax Assessment Total Assessment is a certain percentage of the fair market value that is determined by local assessors to be the total taxable value of land and additions on the property. | Land | Improvement |
|---|---|---|---|---|
| 2025 | $3,069 | $184,800 | $14,300 | $170,500 |
| 2024 | $3,323 | $184,800 | $14,300 | $170,500 |
| 2023 | $3,323 | $157,500 | $14,300 | $143,200 |
| 2022 | $3,334 | $156,200 | $13,000 | $143,200 |
| 2021 | $2,807 | $132,600 | $13,000 | $119,600 |
| 2020 | $2,916 | $136,200 | $6,800 | $129,400 |
| 2019 | $2,212 | $103,000 | $5,700 | $97,300 |
| 2018 | $2,084 | $96,900 | $5,700 | $91,200 |
| 2017 | $2,094 | $96,900 | $5,700 | $91,200 |
| 2016 | $2,079 | $96,900 | $5,700 | $91,200 |
| 2015 | $2,051 | $96,900 | $5,700 | $91,200 |
| 2014 | $2,051 | $96,900 | $5,700 | $91,200 |
Source: Public Records
Map
Nearby Homes