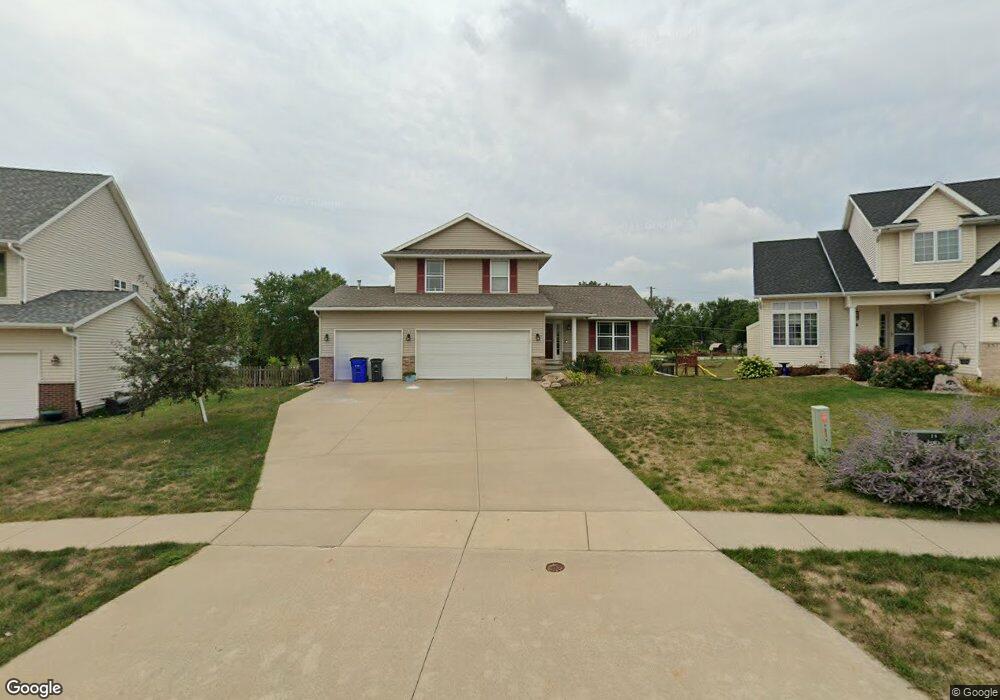
4511 Adams Ct NE Cedar Rapids, IA 52411
Estimated Value: $310,000 - $344,000
4
Beds
4
Baths
1,580
Sq Ft
$208/Sq Ft
Est. Value
About This Home
This home is located at 4511 Adams Ct NE, Cedar Rapids, IA 52411 and is currently estimated at $328,200, approximately $207 per square foot. 4511 Adams Ct NE is a home located in Linn County with nearby schools including Viola Gibson Elementary School, Ponderosa Elementary School, and Harding Middle School.
Ownership History
Date
Name
Owned For
Owner Type
Purchase Details
Closed on
Jan 20, 2022
Sold by
Poshusta Jeremy R
Bought by
Poshusta Kathleen H
Current Estimated Value
Purchase Details
Closed on
Jun 7, 2012
Sold by
Yirkovsky Darren and Yirkovsky Ann
Bought by
Poshusta Jeremy R and Poshusta Kathleen H
Home Financials for this Owner
Home Financials are based on the most recent Mortgage that was taken out on this home.
Original Mortgage
$192,850
Interest Rate
3.87%
Mortgage Type
New Conventional
Purchase Details
Closed on
Jan 10, 2005
Sold by
Akers Construction Llc
Bought by
Yirkovsky Darren and Yirkovsky Ann
Home Financials for this Owner
Home Financials are based on the most recent Mortgage that was taken out on this home.
Original Mortgage
$180,405
Interest Rate
5.83%
Mortgage Type
Purchase Money Mortgage
Create a Home Valuation Report for This Property
The Home Valuation Report is an in-depth analysis detailing your home's value as well as a comparison with similar homes in the area
Home Values in the Area
Average Home Value in this Area
Purchase History
| Date | Buyer | Sale Price | Title Company |
|---|---|---|---|
| Poshusta Kathleen H | -- | None Listed On Document | |
| Poshusta Jeremy R | $203,000 | None Available | |
| Yirkovsky Darren | $189,500 | -- |
Source: Public Records
Mortgage History
| Date | Status | Borrower | Loan Amount |
|---|---|---|---|
| Previous Owner | Poshusta Jeremy R | $192,850 | |
| Previous Owner | Yirkovsky Darren | $180,405 |
Source: Public Records
Tax History Compared to Growth
Tax History
| Year | Tax Paid | Tax Assessment Tax Assessment Total Assessment is a certain percentage of the fair market value that is determined by local assessors to be the total taxable value of land and additions on the property. | Land | Improvement |
|---|---|---|---|---|
| 2025 | $4,622 | $281,500 | $65,700 | $215,800 |
| 2024 | $4,874 | $271,600 | $62,200 | $209,400 |
| 2023 | $4,874 | $271,600 | $62,200 | $209,400 |
| 2022 | $4,788 | $240,000 | $53,600 | $186,400 |
| 2021 | $4,880 | $231,100 | $50,100 | $181,000 |
| 2020 | $4,880 | $221,200 | $41,500 | $179,700 |
| 2019 | $4,486 | $208,100 | $41,500 | $166,600 |
| 2018 | $4,362 | $208,100 | $41,500 | $166,600 |
| 2017 | $4,336 | $206,800 | $41,500 | $165,300 |
| 2016 | $4,336 | $204,000 | $41,500 | $162,500 |
| 2015 | $4,298 | $202,012 | $41,488 | $160,524 |
| 2014 | $4,298 | $204,847 | $41,488 | $163,359 |
| 2013 | $4,266 | $204,847 | $41,488 | $163,359 |
Source: Public Records
Map
Nearby Homes
- 4301 Viola St NE
- 2420 Heritage Green Dr
- 6312 Casey Ln NE
- 2255 Blairsferry Crossing
- 225 Ridgewood Dr
- 5180 Chestnut Valley Rd
- 4620 Prairie Stone Dr NE
- 4408 Prairie Stone Dr NE
- 4510 Prairie Stone Dr NE
- Lot 1A Buffalo Ridge Dr NE
- 4620 N River Blvd NE
- Lot 11 Cross Pointe Blvd NE
- Lot 12 Cross Pointe Blvd NE
- 6524 Michael Dr NE
- 6718 Lauder Ln
- 5843 Wells Ln
- 6720 Caldwell Ln
- 5854 Wells Ln
- 4105 N Willowbend Rd NE
- 5230 Edgewood Rd NE
- 4517 Adams Ct NE
- 4505 Adams Ct NE
- 4425 Adams Ct NE
- 4523 Adams Ct NE
- 4419 Adams Ct NE
- 4508 Adams Ct NE
- 4529 Adams Ct NE
- 4500 Adams Ct NE
- 4418 Adams Ct NE
- 4321 Blairs Ferry Rd
- 4413 Adams Ct NE
- 4516 Adams Ct NE
- 4321 Blairs Ferry Rd
- 4607 Adams Ct NE
- 5807 Spring View Ct NE
- 4407 Adams Ct NE
- 5914 Windy Meadow Ln
- 5914 Windy Meadow Ln NE
- 4602 Adams Ct NE
- 5908 Windy Meadow Ln NE