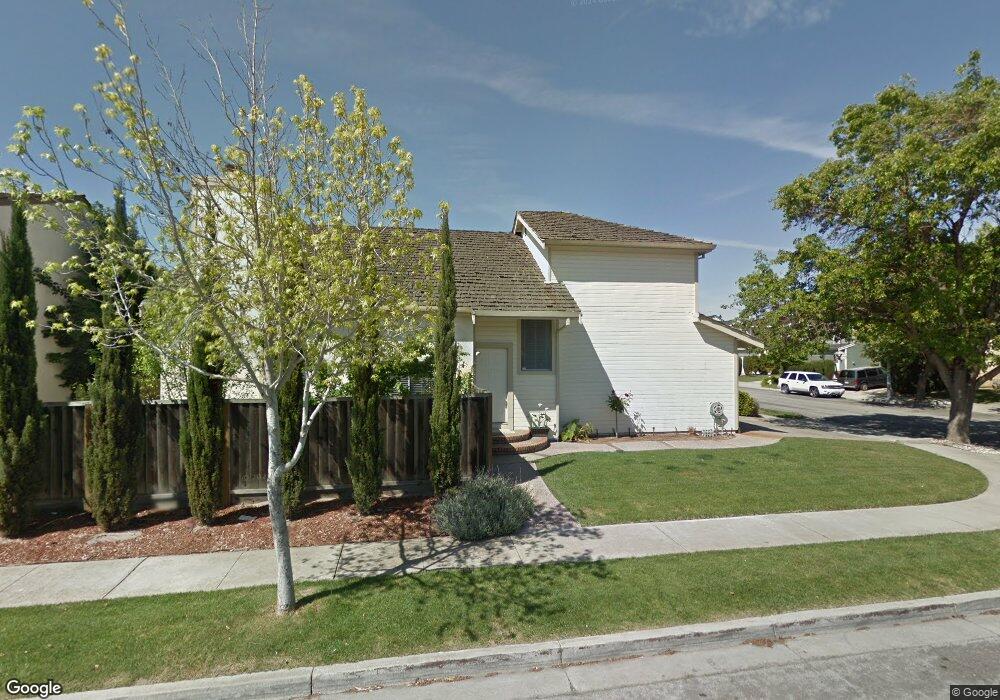
4511 Leonato Way Fremont, CA 94555
Ardenwood NeighborhoodEstimated Value: $1,406,000 - $1,677,000
3
Beds
3
Baths
1,522
Sq Ft
$1,015/Sq Ft
Est. Value
About This Home
This home is located at 4511 Leonato Way, Fremont, CA 94555 and is currently estimated at $1,544,544, approximately $1,014 per square foot. 4511 Leonato Way is a home located in Alameda County with nearby schools including Forest Park Elementary, Thornton Middle School, and American High School.
Ownership History
Date
Name
Owned For
Owner Type
Purchase Details
Closed on
Oct 28, 2021
Sold by
Ranganathan Rangu and Ranganathan Mala
Bought by
Ranganathan Rangu and Ranganathan Mala
Current Estimated Value
Purchase Details
Closed on
Oct 9, 2013
Sold by
Meyyappan Ashok
Bought by
Ranganathan Rangu and Ranganathan Mala
Home Financials for this Owner
Home Financials are based on the most recent Mortgage that was taken out on this home.
Original Mortgage
$409,500
Outstanding Balance
$288,882
Interest Rate
3%
Mortgage Type
Adjustable Rate Mortgage/ARM
Estimated Equity
$1,255,662
Purchase Details
Closed on
Aug 19, 2004
Sold by
Kuang Yi & Kathy Shen Chiu 1992 Living T
Bought by
Meyyappan Ashok and Ramanathan Alamelu
Home Financials for this Owner
Home Financials are based on the most recent Mortgage that was taken out on this home.
Original Mortgage
$480,000
Interest Rate
5%
Mortgage Type
Purchase Money Mortgage
Create a Home Valuation Report for This Property
The Home Valuation Report is an in-depth analysis detailing your home's value as well as a comparison with similar homes in the area
Home Values in the Area
Average Home Value in this Area
Purchase History
| Date | Buyer | Sale Price | Title Company |
|---|---|---|---|
| Ranganathan Rangu | -- | None Available | |
| Ranganathan Rangu | $630,000 | First American Title Company | |
| Meyyappan Ashok | $600,000 | Fidelity Natl Title Walnut |
Source: Public Records
Mortgage History
| Date | Status | Borrower | Loan Amount |
|---|---|---|---|
| Open | Ranganathan Rangu | $409,500 | |
| Previous Owner | Meyyappan Ashok | $480,000 | |
| Closed | Meyyappan Ashok | $55,000 |
Source: Public Records
Tax History Compared to Growth
Tax History
| Year | Tax Paid | Tax Assessment Tax Assessment Total Assessment is a certain percentage of the fair market value that is determined by local assessors to be the total taxable value of land and additions on the property. | Land | Improvement |
|---|---|---|---|---|
| 2025 | $10,078 | $833,550 | $250,065 | $583,485 |
| 2024 | $10,078 | $817,210 | $245,163 | $572,047 |
| 2023 | $9,809 | $801,188 | $240,356 | $560,832 |
| 2022 | $9,683 | $785,481 | $235,644 | $549,837 |
| 2021 | $9,446 | $770,085 | $231,025 | $539,060 |
| 2020 | $9,472 | $762,191 | $228,657 | $533,534 |
| 2019 | $9,365 | $747,251 | $224,175 | $523,076 |
| 2018 | $9,183 | $732,604 | $219,781 | $512,823 |
| 2017 | $8,954 | $718,242 | $215,472 | $502,770 |
| 2016 | $8,803 | $704,160 | $211,248 | $492,912 |
| 2015 | $8,687 | $693,585 | $208,075 | $485,510 |
| 2014 | $8,539 | $680,000 | $204,000 | $476,000 |
Source: Public Records
Map
Nearby Homes
- 4512 Macbeth Ave
- 4480 Norocco Cir
- 34579 Bluestone Common
- 34768 Swain Common
- 4516 Roderigo Ct
- 34656 Greenstone Common
- 34627 Pueblo Terrace
- 34607 Pueblo Terrace
- 34512 Nantucket Common
- 34565 Pueblo Terrace
- 34552 Nantucket Common
- 34648 Musk Terrace
- 4015 Clydesdale Common
- 3840 Springfield Common
- 4243 Nerissa Cir
- 34771 Tuxedo Common Unit 52
- 3851 Milton Terrace
- 5176 Tacoma Common
- 5220 Fairbanks Common
- 34917 Sea Cliff Terrace
- 4521 Leonato Way
- 34379 Benedick Ln
- 4531 Leonato Way
- 34387 Benedick Ln
- 4541 Leonato Way
- 34374 Benedick Ln
- 34366 Benedick Ln
- 34395 Benedick Ln
- 34382 Benedick Ln
- 4551 Leonato Way
- 34358 Benedick Ln
- 4540 Benedick Ct
- 4528 Leonato Way
- 4520 Leonato Way
- 34390 Benedick Ln
- 4536 Leonato Way
- 4512 Leonato Way
- 4560 Benedick Ct
- 34403 Benedick Ln
- 34398 Benedick Ln