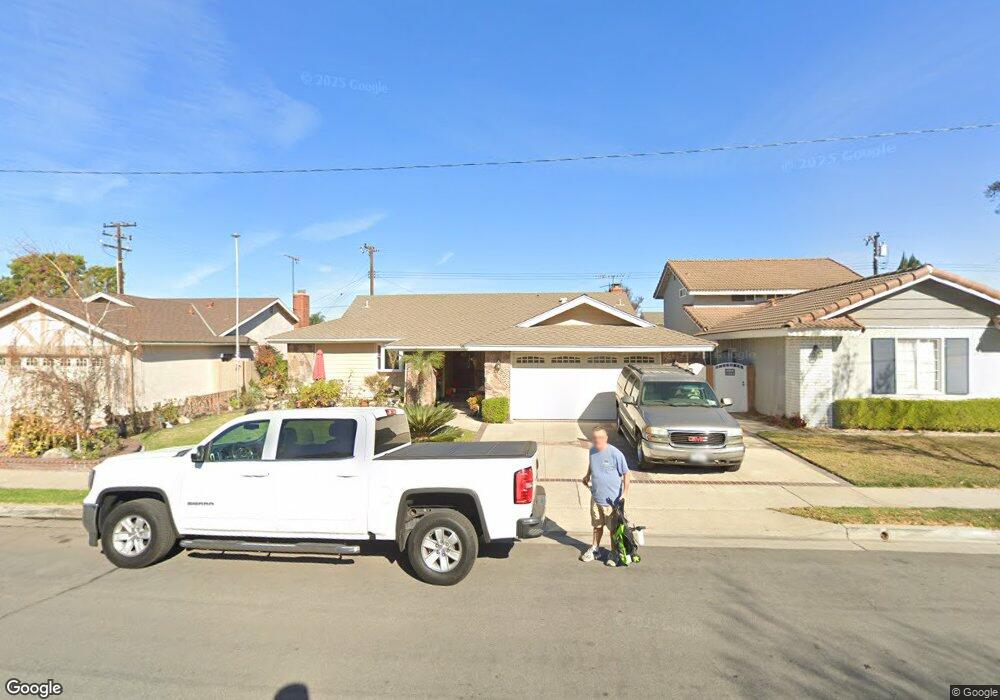
4511 Newman Ave Cypress, CA 90630
Estimated Value: $881,924 - $1,103,000
3
Beds
2
Baths
1,380
Sq Ft
$742/Sq Ft
Est. Value
About This Home
This home is located at 4511 Newman Ave, Cypress, CA 90630 and is currently estimated at $1,024,481, approximately $742 per square foot. 4511 Newman Ave is a home located in Orange County with nearby schools including A.E. Arnold Elementary School, Margaret Landell Elementary School, and Lexington Junior High School.
Ownership History
Date
Name
Owned For
Owner Type
Purchase Details
Closed on
Apr 10, 2024
Sold by
Knight Virgil Ray and Knight Victoria
Bought by
Knight Family Trust and Knight
Current Estimated Value
Purchase Details
Closed on
Oct 11, 2019
Sold by
Knight Virgil Ray and Knight Victoria
Bought by
Knight Virgil Ray and Knight Victoria
Home Financials for this Owner
Home Financials are based on the most recent Mortgage that was taken out on this home.
Original Mortgage
$329,500
Interest Rate
3.5%
Mortgage Type
New Conventional
Purchase Details
Closed on
Jun 14, 1999
Sold by
Baker William A
Bought by
Knight Virgil Ray and Connole Knight Victoria Joyce
Home Financials for this Owner
Home Financials are based on the most recent Mortgage that was taken out on this home.
Original Mortgage
$177,800
Interest Rate
7.64%
Create a Home Valuation Report for This Property
The Home Valuation Report is an in-depth analysis detailing your home's value as well as a comparison with similar homes in the area
Home Values in the Area
Average Home Value in this Area
Purchase History
| Date | Buyer | Sale Price | Title Company |
|---|---|---|---|
| Knight Family Trust | -- | None Listed On Document | |
| Knight Virgil Ray | -- | Orange Coast Title Company | |
| Knight Virgil Ray | $222,500 | South Coast Title Company |
Source: Public Records
Mortgage History
| Date | Status | Borrower | Loan Amount |
|---|---|---|---|
| Previous Owner | Knight Virgil Ray | $329,500 | |
| Previous Owner | Knight Virgil Ray | $177,800 | |
| Closed | Knight Virgil Ray | $33,300 |
Source: Public Records
Tax History
| Year | Tax Paid | Tax Assessment Tax Assessment Total Assessment is a certain percentage of the fair market value that is determined by local assessors to be the total taxable value of land and additions on the property. | Land | Improvement |
|---|---|---|---|---|
| 2025 | $3,953 | $341,659 | $235,509 | $106,150 |
| 2024 | $3,953 | $334,960 | $230,891 | $104,069 |
| 2023 | $3,860 | $328,393 | $226,364 | $102,029 |
| 2022 | $3,811 | $321,954 | $221,925 | $100,029 |
| 2021 | $3,760 | $315,642 | $217,574 | $98,068 |
| 2020 | $3,744 | $312,406 | $215,343 | $97,063 |
| 2019 | $3,641 | $306,281 | $211,121 | $95,160 |
| 2018 | $3,591 | $300,276 | $206,981 | $93,295 |
| 2017 | $3,470 | $294,389 | $202,923 | $91,466 |
| 2016 | $3,439 | $288,617 | $198,944 | $89,673 |
| 2015 | $3,412 | $284,282 | $195,955 | $88,327 |
| 2014 | $3,234 | $278,714 | $192,117 | $86,597 |
Source: Public Records
Map
Nearby Homes
- 9220 Whitney Way
- 4811 Newman Ave
- 9432 Alderbury St
- 9066 Candlestick Ln Unit 5
- 9080 Bloomfield Ave
- 9080 Bloomfield Ave
- 9080 Bloomfield Ave Unit 257
- 9080 Bloomfield Ave Unit 230
- 9080 Bloomfield Ave Unit 223
- 9080 Bloomfield Ave Unit 255
- 9080 Bloomfield Ave Unit 108
- 9080 Bloomfield Ave Unit 31
- 9080 Bloomfield Ave Unit 126
- 9080 Bloomfield Ave Unit 72
- 9080 Bloomfield Ave Unit 209
- 9080 Bloomfield St Unit 257
- 9080 Bloomfield St Unit 231
- 9080 Bloomfield St Unit 270
- 9080 Bloomfield St Unit 145
- 4790 Montefino Dr
- 4521 Newman Ave
- 4501 Newman Ave
- 4538 Blanca Dr
- 9232 Denni St
- 4541 Newman Ave
- 4548 Blanca Dr
- 4512 Newman Ave
- 4522 Newman Ave
- 4502 Newman Ave
- 4558 Blanca Dr
- 4551 Newman Ave
- 4542 Newman Ave
- 4568 Blanca Dr
- 4513 Middlebury Cir
- 4552 Newman Ave
- 4561 Newman Ave
- 4523 Middlebury Cir
- 4539 Blanca Dr
- 4549 Blanca Dr
- 4529 Blanca Dr
Your Personal Tour Guide
Ask me questions while you tour the home.