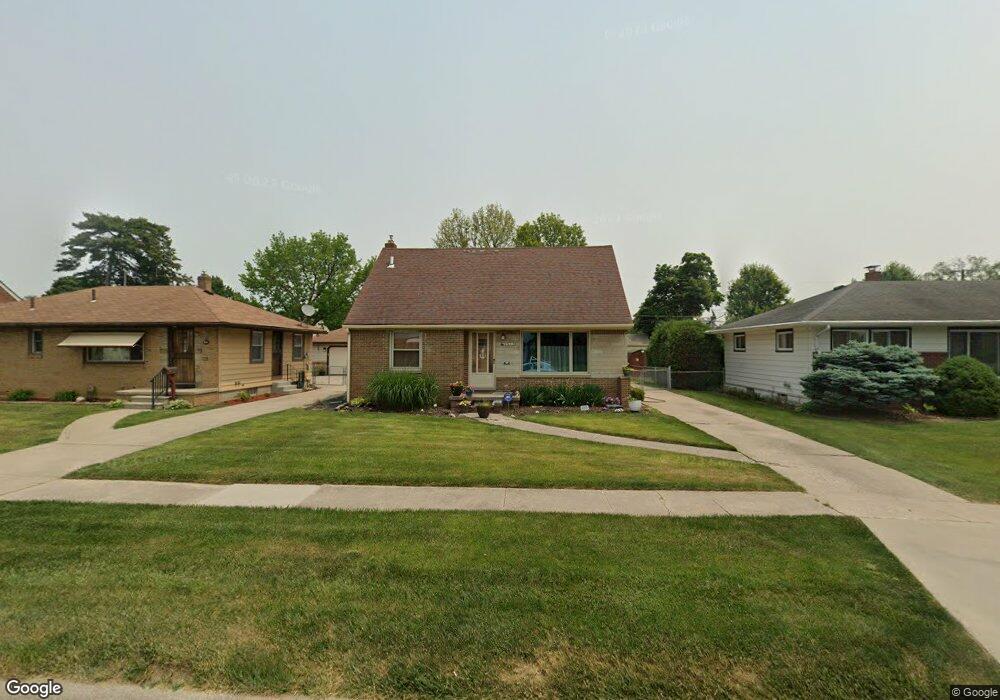
4512 288th St Toledo, OH 43611
Point Place NeighborhoodEstimated Value: $152,000 - $182,000
3
Beds
2
Baths
1,244
Sq Ft
$134/Sq Ft
Est. Value
About This Home
This home is located at 4512 288th St, Toledo, OH 43611 and is currently estimated at $166,453, approximately $133 per square foot. 4512 288th St is a home located in Lucas County with nearby schools including Ottawa River Elementary School, Woodward High School, and Imagine Environmental Science Academy.
Ownership History
Date
Name
Owned For
Owner Type
Purchase Details
Closed on
May 4, 2009
Sold by
Brown Tyler J
Bought by
Becker Kelly K
Current Estimated Value
Home Financials for this Owner
Home Financials are based on the most recent Mortgage that was taken out on this home.
Original Mortgage
$103,098
Outstanding Balance
$65,140
Interest Rate
4.85%
Mortgage Type
FHA
Estimated Equity
$101,313
Purchase Details
Closed on
Jun 15, 2005
Sold by
Crosby Gregory S and Crosby Janice E
Bought by
Brown Tyler J
Home Financials for this Owner
Home Financials are based on the most recent Mortgage that was taken out on this home.
Original Mortgage
$93,765
Interest Rate
5.86%
Mortgage Type
Fannie Mae Freddie Mac
Purchase Details
Closed on
Oct 15, 2001
Sold by
Estate Of William J Crosby
Bought by
Crosby Stella E
Create a Home Valuation Report for This Property
The Home Valuation Report is an in-depth analysis detailing your home's value as well as a comparison with similar homes in the area
Home Values in the Area
Average Home Value in this Area
Purchase History
| Date | Buyer | Sale Price | Title Company |
|---|---|---|---|
| Becker Kelly K | $105,000 | Fidelity Land Title Agency | |
| Brown Tyler J | $98,700 | -- | |
| Crosby Stella E | -- | -- |
Source: Public Records
Mortgage History
| Date | Status | Borrower | Loan Amount |
|---|---|---|---|
| Open | Becker Kelly K | $103,098 | |
| Previous Owner | Brown Tyler J | $93,765 |
Source: Public Records
Tax History Compared to Growth
Tax History
| Year | Tax Paid | Tax Assessment Tax Assessment Total Assessment is a certain percentage of the fair market value that is determined by local assessors to be the total taxable value of land and additions on the property. | Land | Improvement |
|---|---|---|---|---|
| 2024 | $1,021 | $33,075 | $6,930 | $26,145 |
| 2023 | $1,610 | $24,605 | $5,810 | $18,795 |
| 2022 | $1,788 | $27,580 | $5,810 | $21,770 |
| 2021 | $1,828 | $27,580 | $5,810 | $21,770 |
| 2020 | $1,737 | $22,960 | $4,830 | $18,130 |
| 2019 | $1,687 | $22,960 | $4,830 | $18,130 |
| 2018 | $1,651 | $22,960 | $4,830 | $18,130 |
| 2017 | $1,617 | $20,755 | $4,865 | $15,890 |
| 2016 | $1,619 | $59,300 | $13,900 | $45,400 |
| 2015 | $1,606 | $59,300 | $13,900 | $45,400 |
| 2014 | $1,306 | $20,760 | $4,870 | $15,890 |
| 2013 | $1,306 | $20,760 | $4,870 | $15,890 |
Source: Public Records
Map
Nearby Homes