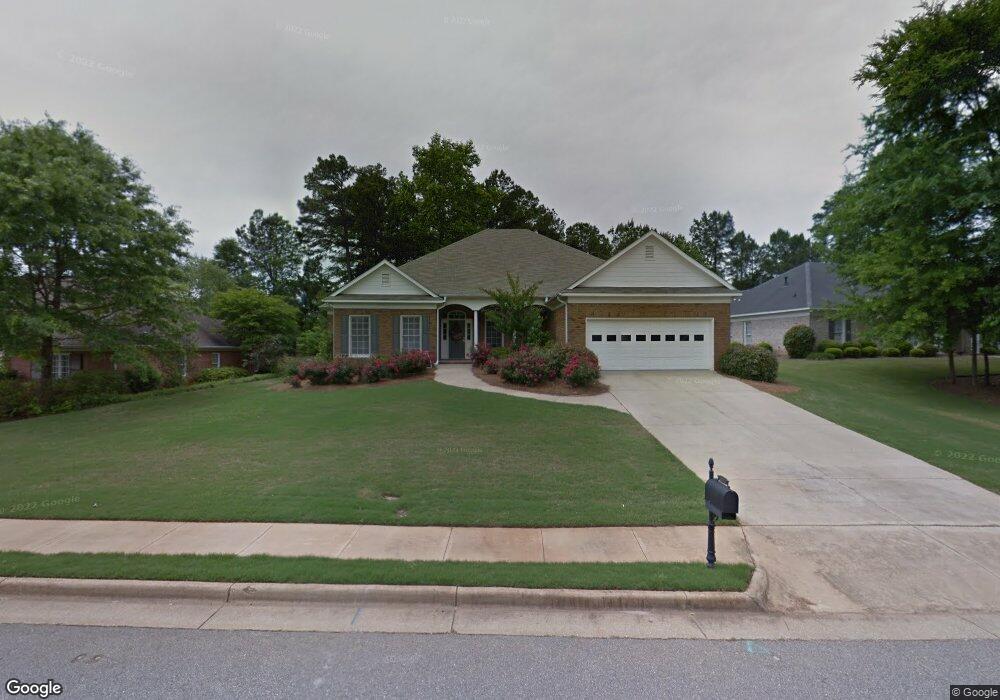
4512 Carnoustie Ln Columbus, GA 31909
Northern Columbus NeighborhoodEstimated Value: $416,487 - $508,000
4
Beds
4
Baths
2,690
Sq Ft
$172/Sq Ft
Est. Value
About This Home
This home is located at 4512 Carnoustie Ln, Columbus, GA 31909 and is currently estimated at $463,122, approximately $172 per square foot. 4512 Carnoustie Ln is a home located in Muscogee County with nearby schools including Eagle Ridge Academy, Blackmon Road Middle School, and Shaw High School.
Ownership History
Date
Name
Owned For
Owner Type
Purchase Details
Closed on
Nov 5, 2014
Sold by
Sung Nathanael R
Bought by
Pandey Surendra N
Current Estimated Value
Home Financials for this Owner
Home Financials are based on the most recent Mortgage that was taken out on this home.
Original Mortgage
$220,000
Outstanding Balance
$169,517
Interest Rate
4.16%
Mortgage Type
New Conventional
Estimated Equity
$293,605
Purchase Details
Closed on
Oct 25, 2013
Sold by
Rische Thorsten
Bought by
Sung Nathanael R and Sung Kristine
Home Financials for this Owner
Home Financials are based on the most recent Mortgage that was taken out on this home.
Original Mortgage
$248,900
Interest Rate
4.33%
Mortgage Type
New Conventional
Purchase Details
Closed on
Oct 2, 2009
Sold by
Kim Hong Woo and Kim Esther
Bought by
Rische Thorsten and Rische Silke E
Home Financials for this Owner
Home Financials are based on the most recent Mortgage that was taken out on this home.
Original Mortgage
$327,000
Interest Rate
5%
Mortgage Type
New Conventional
Create a Home Valuation Report for This Property
The Home Valuation Report is an in-depth analysis detailing your home's value as well as a comparison with similar homes in the area
Home Values in the Area
Average Home Value in this Area
Purchase History
| Date | Buyer | Sale Price | Title Company |
|---|---|---|---|
| Pandey Surendra N | $276,000 | -- | |
| Sung Nathanael R | $262,000 | -- | |
| Rische Thorsten | $327,000 | None Available |
Source: Public Records
Mortgage History
| Date | Status | Borrower | Loan Amount |
|---|---|---|---|
| Open | Pandey Surendra N | $220,000 | |
| Previous Owner | Sung Nathanael R | $248,900 | |
| Previous Owner | Rische Thorsten | $327,000 |
Source: Public Records
Tax History Compared to Growth
Tax History
| Year | Tax Paid | Tax Assessment Tax Assessment Total Assessment is a certain percentage of the fair market value that is determined by local assessors to be the total taxable value of land and additions on the property. | Land | Improvement |
|---|---|---|---|---|
| 2025 | $3,959 | $147,072 | $17,956 | $129,116 |
| 2024 | $3,958 | $147,072 | $17,956 | $129,116 |
| 2023 | $3,289 | $147,072 | $17,956 | $129,116 |
| 2022 | $4,128 | $114,332 | $17,956 | $96,376 |
| 2021 | $4,559 | $111,652 | $17,956 | $93,696 |
| 2020 | $4,560 | $111,652 | $17,956 | $93,696 |
| 2019 | $4,575 | $111,652 | $17,956 | $93,696 |
| 2018 | $4,575 | $111,652 | $17,956 | $93,696 |
| 2017 | $4,589 | $111,652 | $17,956 | $93,696 |
| 2016 | $4,554 | $110,400 | $16,800 | $93,600 |
| 2015 | $4,560 | $110,400 | $16,800 | $93,600 |
| 2014 | $4,333 | $104,799 | $13,460 | $91,339 |
| 2013 | -- | $130,800 | $16,800 | $114,000 |
Source: Public Records
Map
Nearby Homes
- 4880 Turnberry Ln
- 7933 Prestwick Ct
- 4840 Spring Ridge Dr
- 8507 Galena Rd
- 4848 Spring Ridge Dr
- 4854 Champions Way
- 4701 Turnberry Ln Unit 6
- 4756 Timarron Loop
- 8039 Adelaide Dr
- 8000 Cooper Creek Rd
- 8848 Promenade Place
- 7847 Kolven Cove
- 8049 Cooper Creek Rd
- 2040 Old Guard Rd
- 7807 Kolven Cove
- 4691 Talamore Ln
- 8082 Veterans Pkwy
- 9397 Forest Crown Dr
- 9410 Forest Crown Dr
- 4677 Ivy Patch Dr
- 4506 Carnoustie Ln
- 4518 Carnoustie Ln
- 4519 Carnoustie Ln
- 4725 Winged Foot Way
- 4500 Carnoustie Ln
- 4524 Carnoustie Ln
- 4525 Carnoustie Ln
- 5000 Masters Ln
- 4513 Carnoustie Ln
- 4507 Carnoustie Ln
- 4719 Winged Foot Way
- 4501 Carnoustie Ln
- 4713 Winged Foot Way
- 4531 Carnoustie Ln
- 4728 Winged Foot Way
- 4608 Baltusrol Ct
- 4736 Winged Foot Way
- 4614 Baltusrol Ct
- 4724 Winged Foot Way
- 4707 Winged Foot Way