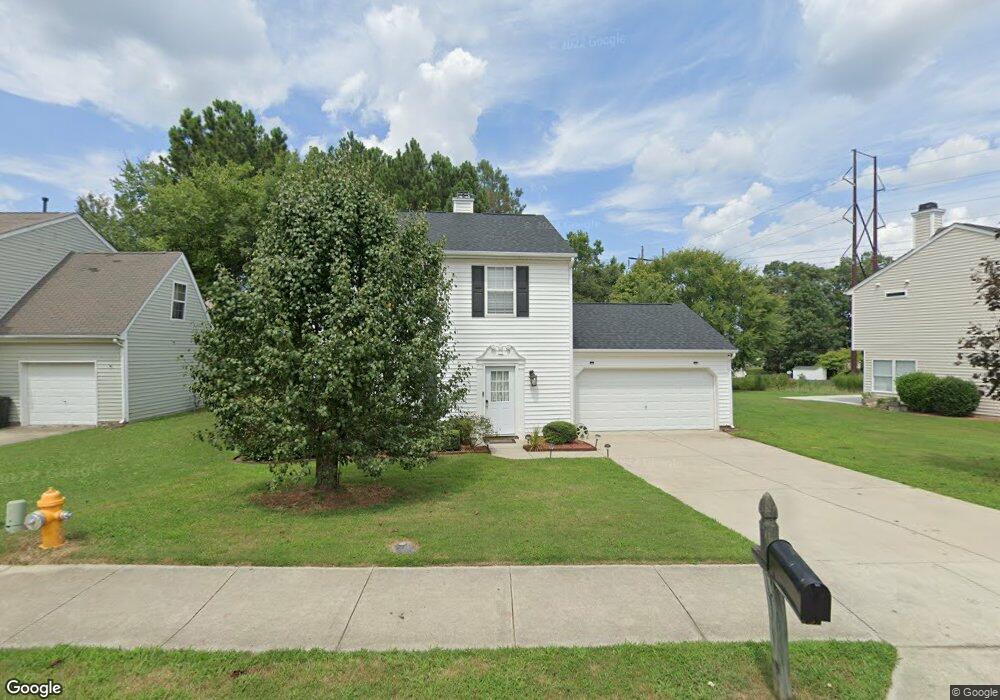
4513 Cobble Creek Ln Raleigh, NC 27616
Northeast Raleigh NeighborhoodEstimated Value: $318,000 - $336,216
3
Beds
3
Baths
1,500
Sq Ft
$217/Sq Ft
Est. Value
About This Home
This home is located at 4513 Cobble Creek Ln, Raleigh, NC 27616 and is currently estimated at $325,804, approximately $217 per square foot. 4513 Cobble Creek Ln is a home located in Wake County with nearby schools including River Bend Elementary, River Bend Middle, and Rolesville High School.
Ownership History
Date
Name
Owned For
Owner Type
Purchase Details
Closed on
May 13, 2019
Sold by
Wilmington Savings Fund Society Fsb
Bought by
Martinez Amortigui Hillarion Omar Eduardo and Martinez Zuniga Tanya
Current Estimated Value
Home Financials for this Owner
Home Financials are based on the most recent Mortgage that was taken out on this home.
Original Mortgage
$187,210
Outstanding Balance
$163,923
Interest Rate
4%
Mortgage Type
New Conventional
Estimated Equity
$161,881
Purchase Details
Closed on
Dec 20, 2018
Sold by
Brock Thomas E
Bought by
Wilmington Savings Fund Society
Purchase Details
Closed on
Nov 18, 2009
Sold by
Horvat Maria
Bought by
Horvat Ferenc
Purchase Details
Closed on
Mar 27, 2001
Sold by
D R Horton Inc Torrey
Bought by
Horvat Ferene and Horvat Maria
Home Financials for this Owner
Home Financials are based on the most recent Mortgage that was taken out on this home.
Original Mortgage
$129,100
Interest Rate
7.02%
Create a Home Valuation Report for This Property
The Home Valuation Report is an in-depth analysis detailing your home's value as well as a comparison with similar homes in the area
Home Values in the Area
Average Home Value in this Area
Purchase History
| Date | Buyer | Sale Price | Title Company |
|---|---|---|---|
| Martinez Amortigui Hillarion Omar Eduardo | $193,000 | None Available | |
| Wilmington Savings Fund Society | $166,500 | None Available | |
| Horvat Ferenc | -- | None Available | |
| Horvat Ferene | $133,500 | -- |
Source: Public Records
Mortgage History
| Date | Status | Borrower | Loan Amount |
|---|---|---|---|
| Open | Martinez Amortigui Hillarion Omar Eduardo | $187,210 | |
| Previous Owner | Horvat Ferene | $129,100 |
Source: Public Records
Tax History Compared to Growth
Tax History
| Year | Tax Paid | Tax Assessment Tax Assessment Total Assessment is a certain percentage of the fair market value that is determined by local assessors to be the total taxable value of land and additions on the property. | Land | Improvement |
|---|---|---|---|---|
| 2025 | $2,948 | $335,719 | $100,000 | $235,719 |
| 2024 | $2,936 | $335,719 | $100,000 | $235,719 |
| 2023 | $2,190 | $199,045 | $44,000 | $155,045 |
| 2022 | $2,035 | $199,045 | $44,000 | $155,045 |
| 2021 | $1,957 | $199,045 | $44,000 | $155,045 |
| 2020 | $1,921 | $199,045 | $44,000 | $155,045 |
| 2019 | $1,775 | $151,421 | $32,000 | $119,421 |
| 2018 | $1,674 | $151,421 | $32,000 | $119,421 |
| 2017 | $1,595 | $151,421 | $32,000 | $119,421 |
| 2016 | $1,563 | $151,421 | $32,000 | $119,421 |
| 2015 | $1,661 | $158,462 | $32,000 | $126,462 |
| 2014 | $1,576 | $158,462 | $32,000 | $126,462 |
Source: Public Records
Map
Nearby Homes
- 3825 Old Coach Rd
- 4443 Antique Ln Unit D1
- 4604 Treadstone Ct
- 4508 Centrebrook Cir
- 4208 Reddington Trail
- 4500 Rivershyre Way
- 3936 Iron Horse Rd
- 3909 Iron Horse Rd
- 4721 Mocha Ln
- 4416 Major Loring Way
- 4106 N New Hope Rd
- 4200 James
- 4317 Woodlawn Dr
- 4809 Arbor Chase Dr
- 4109 St James Church Rd
- 4111 Saint James Church Rd
- 5000 Mocha Ln
- 4217 James Rd
- 3622 Top of the Pines Ct
- 3614 Top of the Pines Ct
- 4517 Cobble Creek Ln
- 4505 Cobble Creek Ln
- 4212 Ivy Hill Rd
- 4208 Ivy Hill Rd
- 4512 Cobble Creek Ln
- 4501 Cobble Creek Ln
- 4504 Cobble Creek Ln
- 4216 Ivy Hill Rd
- 4516 Cobble Creek Ln
- 4220 Ivy Hill Rd
- 4409 Oakshyre Way
- 4500 Cobble Creek Ln
- 4413 Oakshyre Way
- 3912 Old Coach Rd
- 3908 Old Coach Rd
- 4437 Cobble Creek Ln
- 4224 Ivy Hill Rd
- 3916 Old Coach Rd
- 3904 Old Coach Rd
- 4405 Oakshyre Way