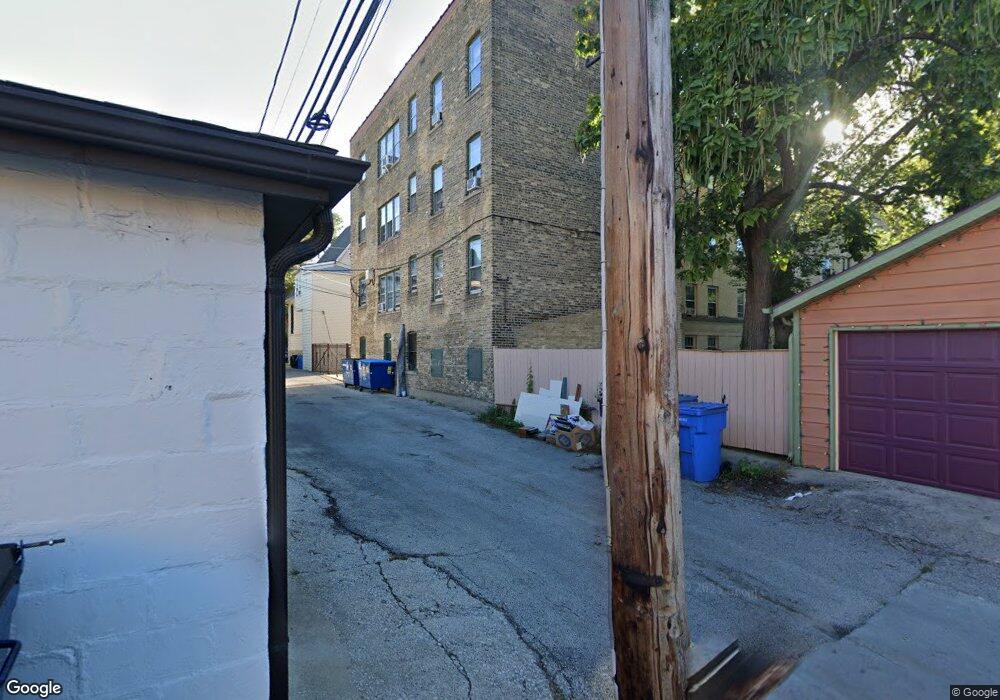
4513 N Hamilton Ave Unit 45133 Chicago, IL 60625
Ravenswood NeighborhoodEstimated Value: $273,000 - $291,000
2
Beds
1
Bath
780
Sq Ft
$360/Sq Ft
Est. Value
About This Home
This home is located at 4513 N Hamilton Ave Unit 45133, Chicago, IL 60625 and is currently estimated at $281,178, approximately $360 per square foot. 4513 N Hamilton Ave Unit 45133 is a home located in Cook County with nearby schools including McPherson Elementary School, Amundsen High School, and Ravenswood Baptist Christian School.
Ownership History
Date
Name
Owned For
Owner Type
Purchase Details
Closed on
Aug 27, 2021
Sold by
Ross Craig S and Ross Charlotte W
Bought by
Spiering Nora E
Current Estimated Value
Home Financials for this Owner
Home Financials are based on the most recent Mortgage that was taken out on this home.
Original Mortgage
$179,600
Outstanding Balance
$163,879
Interest Rate
2.99%
Mortgage Type
New Conventional
Estimated Equity
$117,299
Purchase Details
Closed on
Aug 9, 2016
Sold by
Ross Craig S and Ross Charlotte W
Bought by
Ross Craig S and Ross Charlotte W
Purchase Details
Closed on
Apr 30, 2015
Sold by
Krysler Gary V
Bought by
Ross Craig S and Ross Charlotte W
Home Financials for this Owner
Home Financials are based on the most recent Mortgage that was taken out on this home.
Original Mortgage
$166,500
Interest Rate
3.68%
Mortgage Type
New Conventional
Purchase Details
Closed on
Dec 19, 2009
Sold by
Krysler Gary V
Bought by
Gary V Krysler Revocable Trust
Create a Home Valuation Report for This Property
The Home Valuation Report is an in-depth analysis detailing your home's value as well as a comparison with similar homes in the area
Home Values in the Area
Average Home Value in this Area
Purchase History
| Date | Buyer | Sale Price | Title Company |
|---|---|---|---|
| Spiering Nora E | $224,500 | Stewart Title Company | |
| Ross Craig S | -- | None Available | |
| Ross Craig S | $185,000 | Git | |
| Gary V Krysler Revocable Trust | -- | None Available |
Source: Public Records
Mortgage History
| Date | Status | Borrower | Loan Amount |
|---|---|---|---|
| Open | Spiering Nora E | $179,600 | |
| Previous Owner | Ross Craig S | $166,500 |
Source: Public Records
Tax History Compared to Growth
Tax History
| Year | Tax Paid | Tax Assessment Tax Assessment Total Assessment is a certain percentage of the fair market value that is determined by local assessors to be the total taxable value of land and additions on the property. | Land | Improvement |
|---|---|---|---|---|
| 2024 | $3,523 | $21,518 | $6,108 | $15,410 |
| 2023 | $4,116 | $20,013 | $4,930 | $15,083 |
| 2022 | $4,116 | $20,013 | $4,930 | $15,083 |
| 2021 | $3,355 | $20,012 | $4,930 | $15,082 |
| 2020 | $3,067 | $16,870 | $2,629 | $14,241 |
| 2019 | $3,031 | $18,515 | $2,629 | $15,886 |
| 2018 | $2,979 | $18,515 | $2,629 | $15,886 |
| 2017 | $2,858 | $16,650 | $2,300 | $14,350 |
| 2016 | $2,835 | $16,650 | $2,300 | $14,350 |
| 2015 | $2,570 | $16,650 | $2,300 | $14,350 |
| 2014 | $2,499 | $16,035 | $1,766 | $14,269 |
| 2013 | -- | $16,035 | $1,766 | $14,269 |
Source: Public Records
Map
Nearby Homes
- 2163 W Windsor Ave
- 2034 W Sunnyside Ave
- 2224 W Eastwood Ave
- 4333 N Oakley Ave
- 4545 N Wolcott Ave Unit 1
- 2321 W Montrose Ave
- 1907 W Montrose Ave Unit 2
- 4726 N Winchester Ave Unit C
- 4726 N Winchester Ave Unit F
- 4519 N Western Ave
- 4814 N Damen Ave Unit 209
- 2107 W Berteau Ave
- 2039 W Berteau Ave
- 4147 N Lincoln Ave Unit 3
- 4305 N Wolcott Ave
- 4118 N Lincoln Ave Unit 202
- 2455 W Leland Ave Unit 1
- 4751 N Artesian Ave Unit 205
- 4745 N Ravenswood Ave Unit 210
- 2461 W Pensacola Ave
- 4513 N Hamilton Ave Unit 45132
- 4513 N Hamilton Ave Unit 45131
- 4513 N Hamilton Ave Unit 45131
- 4513 N Hamilton Ave Unit 45133
- 4513 N Hamilton Ave Unit 45132
- 4513 N Hamilton Ave Unit 1W
- 4513 N Hamilton Ave Unit 1E
- 4513 N Hamilton Ave Unit 2W
- 4513 N Hamilton Ave Unit 3W
- 4519 N Hamilton Ave
- 4519 N Hamilton Ave
- 4511 N Hamilton Ave Unit 45113
- 4511 N Hamilton Ave Unit 45112
- 4511 N Hamilton Ave Unit 45111
- 4511 N Hamilton Ave Unit 3
- 4511 N Hamilton Ave Unit 2
- 4511 N Hamilton Ave Unit 1
- 4515 N Hamilton Ave Unit 45153
- 4515 N Hamilton Ave Unit 45152
- 4515 N Hamilton Ave Unit 45153