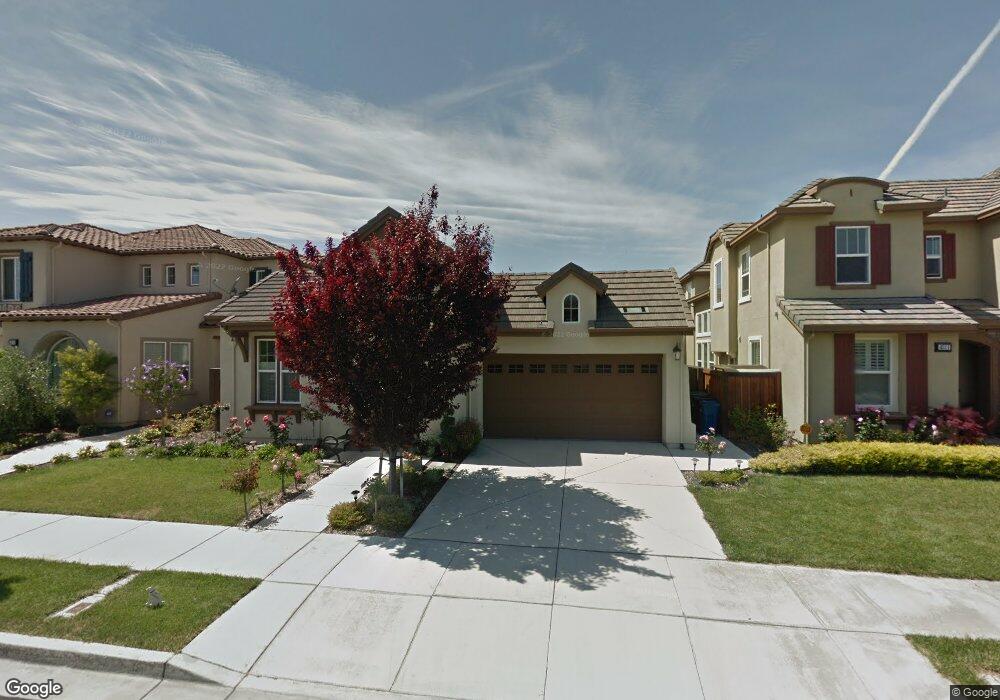
4515 Arce St Union City, CA 94587
Alvarado NeighborhoodEstimated Value: $1,742,000 - $1,997,000
4
Beds
3
Baths
2,213
Sq Ft
$842/Sq Ft
Est. Value
About This Home
This home is located at 4515 Arce St, Union City, CA 94587 and is currently estimated at $1,863,886, approximately $842 per square foot. 4515 Arce St is a home located in Alameda County with nearby schools including Pioneer Elementary School, Itliong-Vera Cruz, and James Logan High School.
Ownership History
Date
Name
Owned For
Owner Type
Purchase Details
Closed on
Jun 26, 2020
Sold by
Dao Tony Nauyen Thien and Lu Tricia Fong
Bought by
Lu Tricia Fong Hua
Current Estimated Value
Purchase Details
Closed on
Oct 14, 2010
Sold by
Dao Tony Nguyen Thien and Lu Tricia Fong Hua
Bought by
Dao Tony Nguyen Thien and Lu Tricia Fong Hua
Home Financials for this Owner
Home Financials are based on the most recent Mortgage that was taken out on this home.
Original Mortgage
$400,000
Interest Rate
4.31%
Mortgage Type
New Conventional
Purchase Details
Closed on
Apr 25, 2007
Sold by
Summerhill Talavera Llc
Bought by
Dao Tony and Lu Tricia Fong Hua
Home Financials for this Owner
Home Financials are based on the most recent Mortgage that was taken out on this home.
Original Mortgage
$365,000
Interest Rate
6.4%
Mortgage Type
Purchase Money Mortgage
Create a Home Valuation Report for This Property
The Home Valuation Report is an in-depth analysis detailing your home's value as well as a comparison with similar homes in the area
Home Values in the Area
Average Home Value in this Area
Purchase History
| Date | Buyer | Sale Price | Title Company |
|---|---|---|---|
| Lu Tricia Fong Hua | -- | None Available | |
| Dao Tony Nguyen Thien | -- | Chicago Title Company | |
| Dao Tony | $865,000 | First American Title Co |
Source: Public Records
Mortgage History
| Date | Status | Borrower | Loan Amount |
|---|---|---|---|
| Previous Owner | Dao Tony Nguyen Thien | $400,000 | |
| Previous Owner | Dao Tony | $365,000 |
Source: Public Records
Tax History
| Year | Tax Paid | Tax Assessment Tax Assessment Total Assessment is a certain percentage of the fair market value that is determined by local assessors to be the total taxable value of land and additions on the property. | Land | Improvement |
|---|---|---|---|---|
| 2025 | $15,869 | $1,129,116 | $341,491 | $794,625 |
| 2024 | $15,869 | $1,106,842 | $334,796 | $779,046 |
| 2023 | $15,397 | $1,092,010 | $328,234 | $763,776 |
| 2022 | $15,205 | $1,063,601 | $321,799 | $748,802 |
| 2021 | $14,811 | $1,042,616 | $315,491 | $734,125 |
| 2020 | $14,735 | $1,038,855 | $312,257 | $726,598 |
| 2019 | $14,635 | $1,018,494 | $306,137 | $712,357 |
| 2018 | $14,291 | $998,529 | $300,136 | $698,393 |
| 2017 | $13,997 | $978,954 | $294,252 | $684,702 |
| 2016 | $13,694 | $959,760 | $288,483 | $671,277 |
| 2015 | $12,510 | $863,000 | $258,900 | $604,100 |
| 2014 | $11,683 | $820,000 | $246,000 | $574,000 |
Source: Public Records
Map
Nearby Homes
- 4600 Delores Dr
- 4940 Bunkhouse St
- 4819 Kenwood St
- 4822 La Habra St
- 4291 Polaris Ave
- 4141 Deep Creek Rd Unit 89
- 4141 Deep Creek Rd Unit 106
- 4141 Deep Creek Rd Unit 84
- 3965 Lake Tahoe Terrace
- 4270 Comet Cir
- 4388 Planet Cir
- 34270 Stable Way
- 4625 Ruth Way
- 4336 Planet Cir
- 4309 Jessica Cir
- 5064 Anaheim Loop
- 32301 Ruth Ct
- 33454 Bronco Loop
- 4968 Friar Ave
- 4542 Amiens Ave
Your Personal Tour Guide
Ask me questions while you tour the home.