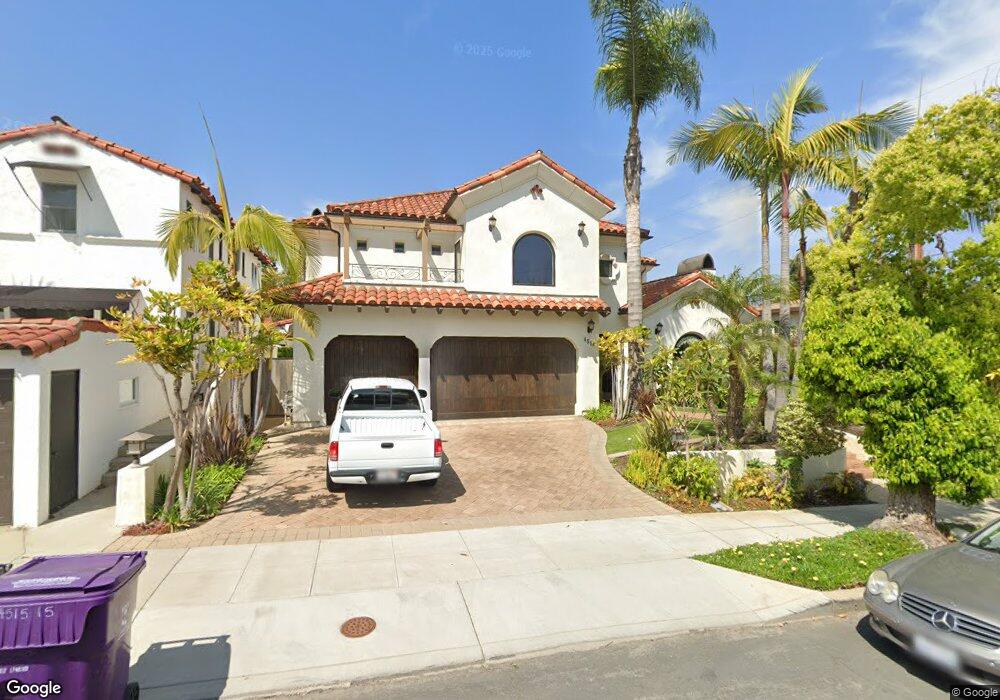
4515 E Vista St Long Beach, CA 90803
Belmont Heights NeighborhoodEstimated Value: $1,396,000 - $2,792,000
5
Beds
6
Baths
4,048
Sq Ft
$568/Sq Ft
Est. Value
About This Home
This home is located at 4515 E Vista St, Long Beach, CA 90803 and is currently estimated at $2,297,393, approximately $567 per square foot. 4515 E Vista St is a home located in Los Angeles County with nearby schools including Lowell Elementary School, Rogers Middle School, and Woodrow Wilson High School.
Ownership History
Date
Name
Owned For
Owner Type
Purchase Details
Closed on
Jan 3, 2005
Sold by
Morrad Chaim and Morrad Raya
Bought by
Weinberg Amit
Current Estimated Value
Purchase Details
Closed on
Dec 23, 2003
Sold by
Smith Evelyn L and Blumer Suzanne E
Bought by
Morrad Chaim
Home Financials for this Owner
Home Financials are based on the most recent Mortgage that was taken out on this home.
Original Mortgage
$450,000
Interest Rate
5.82%
Mortgage Type
Purchase Money Mortgage
Purchase Details
Closed on
Aug 12, 2002
Sold by
Smith Evelyn L
Bought by
Smith Evelyn L
Purchase Details
Closed on
Feb 16, 2001
Sold by
Smith Evelyn L and Smith Evelyn Lillian
Bought by
Smith Evelyn L
Create a Home Valuation Report for This Property
The Home Valuation Report is an in-depth analysis detailing your home's value as well as a comparison with similar homes in the area
Home Values in the Area
Average Home Value in this Area
Purchase History
| Date | Buyer | Sale Price | Title Company |
|---|---|---|---|
| Weinberg Amit | -- | -- | |
| Morrad Chaim | $500,000 | Diversified Title & Escrow S | |
| Smith Evelyn L | -- | -- | |
| Smith Evelyn L | -- | -- |
Source: Public Records
Mortgage History
| Date | Status | Borrower | Loan Amount |
|---|---|---|---|
| Previous Owner | Morrad Chaim | $450,000 |
Source: Public Records
Tax History
| Year | Tax Paid | Tax Assessment Tax Assessment Total Assessment is a certain percentage of the fair market value that is determined by local assessors to be the total taxable value of land and additions on the property. | Land | Improvement |
|---|---|---|---|---|
| 2025 | $17,514 | $1,390,569 | $748,525 | $642,044 |
| 2024 | $17,514 | $1,363,304 | $733,849 | $629,455 |
| 2023 | $17,228 | $1,336,573 | $719,460 | $617,113 |
| 2022 | $16,166 | $1,310,366 | $705,353 | $605,013 |
| 2021 | $15,846 | $1,284,673 | $691,523 | $593,150 |
| 2020 | $15,803 | $1,271,501 | $684,433 | $587,068 |
| 2019 | $15,620 | $1,246,570 | $671,013 | $575,557 |
| 2018 | $15,201 | $1,222,128 | $657,856 | $564,272 |
| 2016 | $13,963 | $1,174,672 | $632,311 | $542,361 |
| 2015 | $13,394 | $1,157,029 | $622,814 | $534,215 |
| 2014 | $13,286 | $1,134,365 | $610,614 | $523,751 |
Source: Public Records
Map
Nearby Homes
- 260 Prospect Ave
- 243 Ximeno Ave
- 4527 E Shaw St
- 266 Park Ave
- 280 Park Ave
- 223 Bennett Ave
- 150 Ximeno Ave
- 205 Argonne Ave
- 4741 E Colorado St
- 4401 E Division St
- 143 Roycroft Ave
- 132 Belmont Ave
- 267 Nieto Ave
- 235 Termino Ave Unit 1
- 220 Granada Ave
- 5120 E Livingston Dr
- 383 Park Ave
- 111 Ximeno Ave
- 116 Termino Ave
- 108 Roycroft Ave
- 4503 E Vista St
- 4525 E Vista St
- 254 Prospect Ave
- 256 Prospect Ave
- 255 Quincy Ave
- 251 Quincy Ave
- 4518 E Vista St
- 253 Quincy Ave
- 4535 E Vista St
- 250 Prospect Ave
- 257 Quincy Ave
- 4522 E Vista St
- 4439 E Vista St
- 258 Prospect Ave Unit A
- 244 Prospect Ave
- 247 Quincy Ave
- 259 Quincy Ave
- 4431 E Vista St
- 245 Quincy Ave
- 255 Prospect Ave
Your Personal Tour Guide
Ask me questions while you tour the home.