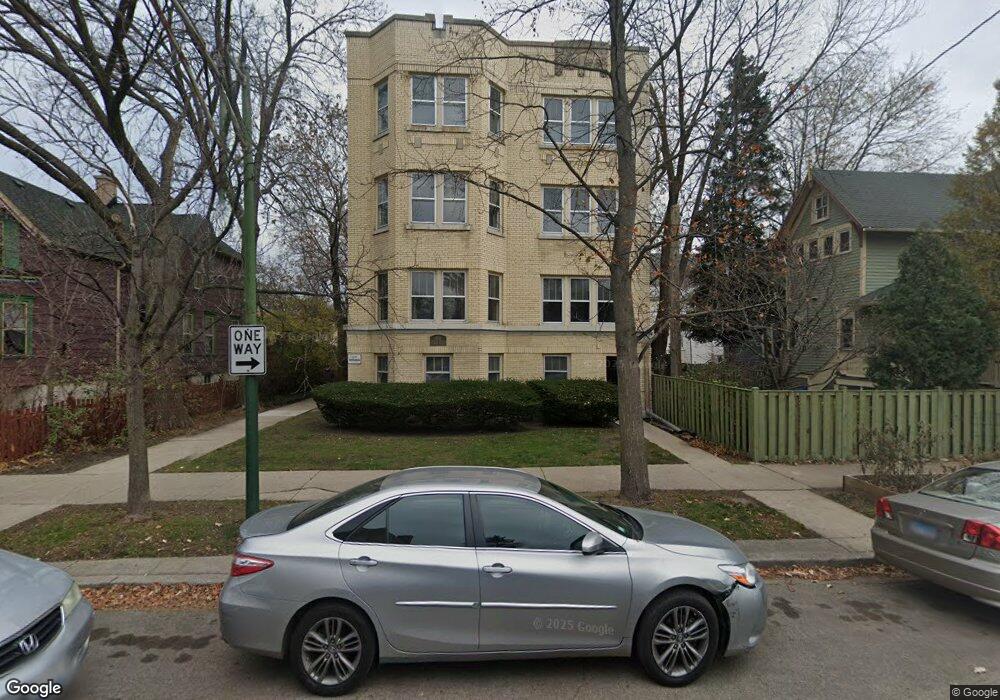
4515 N Hamilton Ave Unit 45153 Chicago, IL 60625
Ravenswood NeighborhoodEstimated Value: $258,303 - $354,000
1
Bed
1
Bath
964
Sq Ft
$304/Sq Ft
Est. Value
About This Home
This home is located at 4515 N Hamilton Ave Unit 45153, Chicago, IL 60625 and is currently estimated at $292,576, approximately $303 per square foot. 4515 N Hamilton Ave Unit 45153 is a home located in Cook County with nearby schools including McPherson Elementary School, Amundsen High School, and Ravenswood Baptist Christian School.
Ownership History
Date
Name
Owned For
Owner Type
Purchase Details
Closed on
Mar 15, 2018
Sold by
Yang Allen and Taylor Mary A
Bought by
Almeida Mark Lino
Current Estimated Value
Home Financials for this Owner
Home Financials are based on the most recent Mortgage that was taken out on this home.
Original Mortgage
$160,800
Outstanding Balance
$93,289
Interest Rate
4.32%
Mortgage Type
New Conventional
Estimated Equity
$199,287
Purchase Details
Closed on
Sep 8, 2000
Sold by
Dall Lisa A
Bought by
Taylor Mary A
Home Financials for this Owner
Home Financials are based on the most recent Mortgage that was taken out on this home.
Original Mortgage
$137,700
Interest Rate
8.14%
Purchase Details
Closed on
May 23, 1995
Sold by
Albany Bank & Trust Company Na
Bought by
Dall Lisa A
Home Financials for this Owner
Home Financials are based on the most recent Mortgage that was taken out on this home.
Original Mortgage
$56,300
Interest Rate
7.62%
Create a Home Valuation Report for This Property
The Home Valuation Report is an in-depth analysis detailing your home's value as well as a comparison with similar homes in the area
Home Values in the Area
Average Home Value in this Area
Purchase History
| Date | Buyer | Sale Price | Title Company |
|---|---|---|---|
| Almeida Mark Lino | $201,000 | Old Republic Title | |
| Taylor Mary A | $153,000 | Chicago Title Insurance Co | |
| Dall Lisa A | $70,500 | -- |
Source: Public Records
Mortgage History
| Date | Status | Borrower | Loan Amount |
|---|---|---|---|
| Open | Almeida Mark Lino | $160,800 | |
| Previous Owner | Taylor Mary A | $137,700 | |
| Previous Owner | Dall Lisa A | $56,300 |
Source: Public Records
Tax History Compared to Growth
Tax History
| Year | Tax Paid | Tax Assessment Tax Assessment Total Assessment is a certain percentage of the fair market value that is determined by local assessors to be the total taxable value of land and additions on the property. | Land | Improvement |
|---|---|---|---|---|
| 2024 | $3,241 | $20,082 | $5,700 | $14,382 |
| 2023 | $3,138 | $18,677 | $4,601 | $14,076 |
| 2022 | $3,138 | $18,677 | $4,601 | $14,076 |
| 2021 | $3,086 | $18,675 | $4,600 | $14,075 |
| 2020 | $3,507 | $15,743 | $2,453 | $13,290 |
| 2019 | $3,472 | $17,279 | $2,453 | $14,826 |
| 2018 | $2,735 | $17,279 | $2,453 | $14,826 |
| 2017 | $2,618 | $15,539 | $2,147 | $13,392 |
| 2016 | $2,612 | $15,539 | $2,147 | $13,392 |
| 2015 | $2,367 | $15,539 | $2,147 | $13,392 |
| 2014 | $2,300 | $14,964 | $1,648 | $13,316 |
| 2013 | $2,243 | $14,964 | $1,648 | $13,316 |
Source: Public Records
Map
Nearby Homes
- 2034 W Sunnyside Ave
- 2163 W Windsor Ave
- 2224 W Eastwood Ave
- 4545 N Wolcott Ave Unit 1
- 4333 N Oakley Ave
- 1907 W Montrose Ave Unit 2
- 2321 W Montrose Ave
- 4726 N Winchester Ave Unit C
- 4726 N Winchester Ave Unit F
- 4519 N Western Ave
- 4814 N Damen Ave Unit 209
- 2107 W Berteau Ave
- 2039 W Berteau Ave
- 4845 N Leavitt St
- 4305 N Wolcott Ave
- 4118 N Lincoln Ave Unit 202
- 4745 N Ravenswood Ave Unit 210
- 2455 W Leland Ave Unit 1
- 4751 N Artesian Ave Unit 205
- 4906 N Winchester Ave
- 4515 N Hamilton Ave Unit 45152
- 4515 N Hamilton Ave Unit 45153
- 4515 N Hamilton Ave Unit 45151
- 4515 N Hamilton Ave Unit 45152
- 4515 N Hamilton Ave Unit 45151
- 4515 N Hamilton Ave Unit 3E
- 4515 N Hamilton Ave Unit 2E
- 4515 N Hamilton Ave Unit 2W
- 4515 N Hamilton Ave Unit 1W
- 4511 N Hamilton Ave Unit 45113
- 4511 N Hamilton Ave Unit 45112
- 4511 N Hamilton Ave Unit 45111
- 4511 N Hamilton Ave Unit 3
- 4511 N Hamilton Ave Unit 2
- 4511 N Hamilton Ave Unit 1
- 4513 N Hamilton Ave Unit 45132
- 4513 N Hamilton Ave Unit 45131
- 4513 N Hamilton Ave Unit 45131
- 4513 N Hamilton Ave Unit 45133
- 4513 N Hamilton Ave Unit 45132