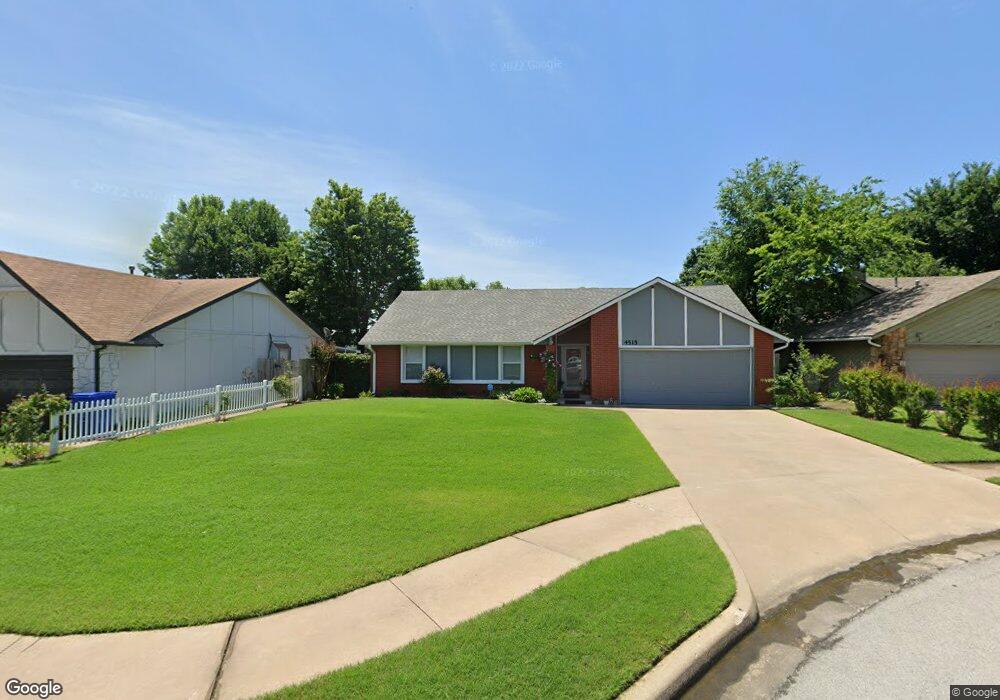
4515 W Lansing Place Broken Arrow, OK 74012
Southbrook NeighborhoodEstimated Value: $197,278 - $222,000
3
Beds
2
Baths
1,338
Sq Ft
$157/Sq Ft
Est. Value
About This Home
This home is located at 4515 W Lansing Place, Broken Arrow, OK 74012 and is currently estimated at $209,570, approximately $156 per square foot. 4515 W Lansing Place is a home located in Tulsa County with nearby schools including Marshall T. Moore Elementary School, Union 8th Grade Center, and Union 6th-7th Grade Center.
Ownership History
Date
Name
Owned For
Owner Type
Purchase Details
Closed on
Mar 13, 2003
Sold by
Wilson Kelly Dale and Wilson Fred A
Bought by
Garcia Estela
Current Estimated Value
Home Financials for this Owner
Home Financials are based on the most recent Mortgage that was taken out on this home.
Original Mortgage
$76,000
Outstanding Balance
$32,044
Interest Rate
5.86%
Mortgage Type
Purchase Money Mortgage
Estimated Equity
$177,526
Purchase Details
Closed on
Nov 1, 1989
Purchase Details
Closed on
Jun 1, 1984
Create a Home Valuation Report for This Property
The Home Valuation Report is an in-depth analysis detailing your home's value as well as a comparison with similar homes in the area
Home Values in the Area
Average Home Value in this Area
Purchase History
| Date | Buyer | Sale Price | Title Company |
|---|---|---|---|
| Garcia Estela | $95,000 | Scott Title & Escrow Co Inc | |
| -- | $65,500 | -- | |
| -- | $67,500 | -- |
Source: Public Records
Mortgage History
| Date | Status | Borrower | Loan Amount |
|---|---|---|---|
| Open | Garcia Estela | $76,000 |
Source: Public Records
Tax History Compared to Growth
Tax History
| Year | Tax Paid | Tax Assessment Tax Assessment Total Assessment is a certain percentage of the fair market value that is determined by local assessors to be the total taxable value of land and additions on the property. | Land | Improvement |
|---|---|---|---|---|
| 2025 | $1,398 | $10,650 | $1,732 | $8,918 |
| 2024 | $1,374 | $10,650 | $1,999 | $8,651 |
| 2023 | $1,374 | $12,650 | $2,332 | $10,318 |
| 2022 | $1,386 | $10,650 | $2,825 | $7,825 |
| 2021 | $1,390 | $10,650 | $2,825 | $7,825 |
| 2020 | $1,486 | $11,306 | $2,991 | $8,315 |
| 2019 | $1,436 | $10,948 | $2,896 | $8,052 |
| 2018 | $1,387 | $10,600 | $2,804 | $7,796 |
| 2017 | $1,360 | $11,262 | $2,980 | $8,282 |
| 2016 | $1,299 | $10,934 | $3,355 | $7,579 |
| 2015 | $1,300 | $10,934 | $3,355 | $7,579 |
| 2014 | $1,292 | $10,934 | $3,355 | $7,579 |
Source: Public Records
Map
Nearby Homes
- 1216 N Cypress Ave
- 911 N Butternut Ct
- 2416 W Lansing Place
- 905 N Butternut Ave
- 1312 N Willow Ave
- 708 N Aster Ave
- 4501 W Hartford St
- 1429 N Yellowood Ave
- 4441 W Queens St
- 6727 S 112th East Ave
- 4408 W Elgin St
- 1812 N Butternut Ave
- 304 N Eucalyptus Ct
- 1908 N Cypress Ave
- 4201 W Detroit St
- 6526 S 111th East Ave
- 6529 S 110th Ave E
- 1316 N Nyssa Ave
- 10623 E 74th St
- 3413 W Norman St
- 4521 W Lansing Place
- 4511 W Lansing Place
- 4519 W Lansing Place
- 4516 W Lansing St
- 4512 W Lansing St
- 4507 W Lansing Place
- 4520 W Lansing St
- 4523 W Lansing Place
- 4508 W Lansing St
- 8508 E 8th St
- 4510 W Lansing Place
- 4524 W Lansing St
- 4518 W Lansing Place
- 4503 W Lansing Place
- 4514 W Lansing Place
- 4504 W Lansing St
- 4502 W Lansing Place
- 1105 N Cypress Ave
- 1113 N Cypress Ave
- 1117 N Cypress Ave
