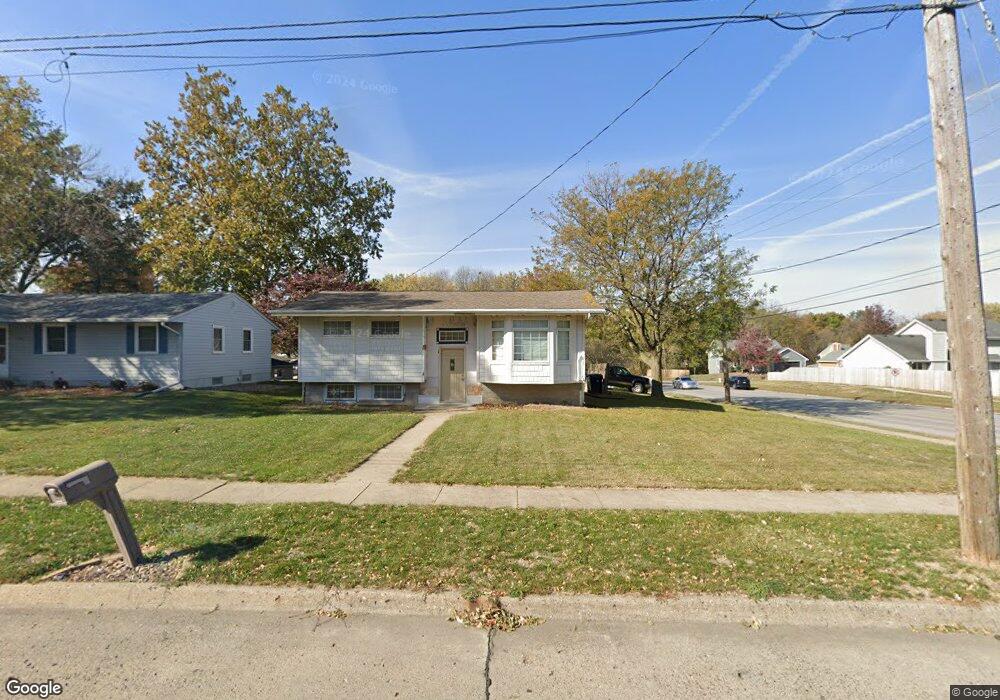
4516 65th St Urbandale, IA 50322
Estimated Value: $204,000 - $264,000
2
Beds
2
Baths
868
Sq Ft
$264/Sq Ft
Est. Value
About This Home
This home is located at 4516 65th St, Urbandale, IA 50322 and is currently estimated at $229,175, approximately $264 per square foot. 4516 65th St is a home located in Polk County with nearby schools including Urbandale Middle School, Urbandale High School, and St Pius X School.
Ownership History
Date
Name
Owned For
Owner Type
Purchase Details
Closed on
May 12, 2005
Sold by
J E Reed Enterprises Lc
Bought by
Volz Scott A
Current Estimated Value
Home Financials for this Owner
Home Financials are based on the most recent Mortgage that was taken out on this home.
Original Mortgage
$99,200
Interest Rate
6.05%
Mortgage Type
Fannie Mae Freddie Mac
Purchase Details
Closed on
Jul 15, 2002
Sold by
J E Reed Enterprises Lc
Bought by
Volz Scott A
Home Financials for this Owner
Home Financials are based on the most recent Mortgage that was taken out on this home.
Original Mortgage
$100,000
Interest Rate
7%
Mortgage Type
Land Contract Argmt. Of Sale
Create a Home Valuation Report for This Property
The Home Valuation Report is an in-depth analysis detailing your home's value as well as a comparison with similar homes in the area
Home Values in the Area
Average Home Value in this Area
Purchase History
| Date | Buyer | Sale Price | Title Company |
|---|---|---|---|
| Volz Scott A | $104,500 | -- | |
| Volz Scott A | $105,000 | -- |
Source: Public Records
Mortgage History
| Date | Status | Borrower | Loan Amount |
|---|---|---|---|
| Closed | Volz Scott A | $99,200 | |
| Previous Owner | Volz Scott A | $100,000 |
Source: Public Records
Tax History Compared to Growth
Tax History
| Year | Tax Paid | Tax Assessment Tax Assessment Total Assessment is a certain percentage of the fair market value that is determined by local assessors to be the total taxable value of land and additions on the property. | Land | Improvement |
|---|---|---|---|---|
| 2025 | $3,494 | $214,300 | $65,800 | $148,500 |
| 2024 | $3,494 | $203,400 | $61,600 | $141,800 |
| 2023 | $3,276 | $203,400 | $61,600 | $141,800 |
| 2022 | $3,238 | $161,600 | $50,300 | $111,300 |
| 2021 | $3,126 | $161,600 | $50,300 | $111,300 |
| 2020 | $3,068 | $148,500 | $46,200 | $102,300 |
| 2019 | $2,918 | $148,500 | $46,200 | $102,300 |
| 2018 | $2,808 | $135,400 | $41,200 | $94,200 |
| 2017 | $2,854 | $135,400 | $41,200 | $94,200 |
| 2016 | $2,780 | $135,100 | $34,000 | $101,100 |
| 2015 | $2,780 | $135,100 | $34,000 | $101,100 |
| 2014 | $2,500 | $126,200 | $31,100 | $95,100 |
Source: Public Records
Map
Nearby Homes