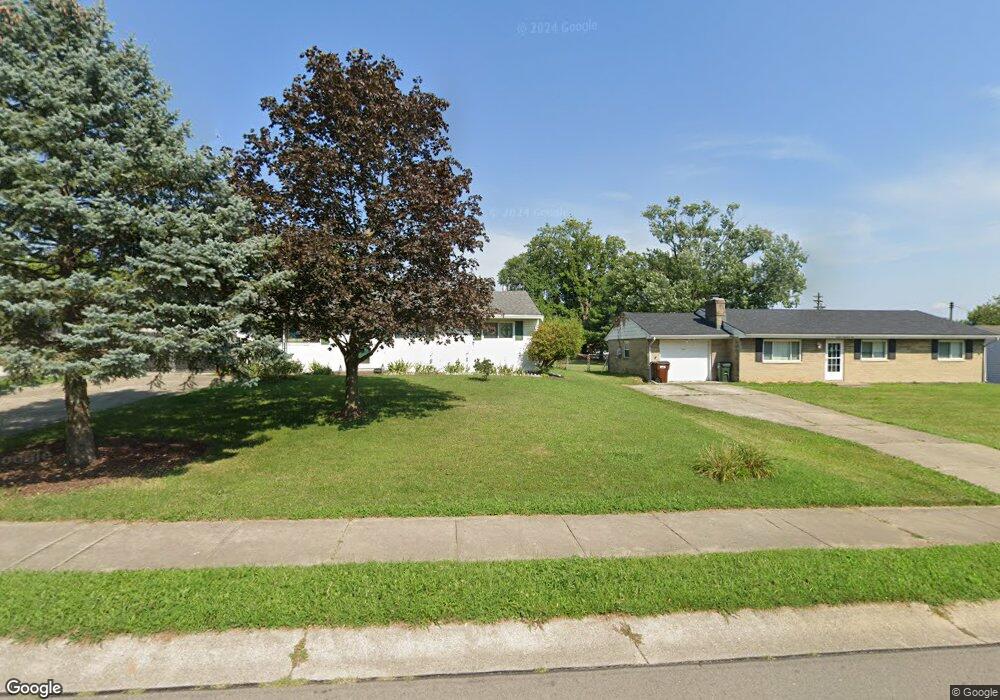
4516 Shawnray Dr Unit 43 Middletown, OH 45044
Far Hills NeighborhoodEstimated Value: $90,000 - $120,000
2
Beds
2
Baths
980
Sq Ft
$105/Sq Ft
Est. Value
About This Home
This home is located at 4516 Shawnray Dr Unit 43, Middletown, OH 45044 and is currently estimated at $102,676, approximately $104 per square foot. 4516 Shawnray Dr Unit 43 is a home located in Butler County with nearby schools including Creekview Elementary School, Highview 6th Grade Center, and Middletown Middle School.
Ownership History
Date
Name
Owned For
Owner Type
Purchase Details
Closed on
Mar 13, 2015
Sold by
Biddle Cory and Biddle Sarah
Bought by
Mcintosh Tracy E and Schlenk Jared S
Current Estimated Value
Home Financials for this Owner
Home Financials are based on the most recent Mortgage that was taken out on this home.
Original Mortgage
$29,520
Outstanding Balance
$22,601
Interest Rate
3.67%
Mortgage Type
New Conventional
Estimated Equity
$80,075
Purchase Details
Closed on
Sep 15, 2008
Sold by
Countrywide Home Loans Inc
Bought by
Biddle Cory and Heath Sarah
Home Financials for this Owner
Home Financials are based on the most recent Mortgage that was taken out on this home.
Original Mortgage
$34,865
Interest Rate
6.48%
Mortgage Type
FHA
Purchase Details
Closed on
Jul 1, 2008
Sold by
Margerum Darlene
Bought by
Merrill Lynch Mortgage Capital Inc
Create a Home Valuation Report for This Property
The Home Valuation Report is an in-depth analysis detailing your home's value as well as a comparison with similar homes in the area
Home Values in the Area
Average Home Value in this Area
Purchase History
| Date | Buyer | Sale Price | Title Company |
|---|---|---|---|
| Mcintosh Tracy E | $36,900 | None Available | |
| Biddle Cory | $35,500 | Attorney | |
| Merrill Lynch Mortgage Capital Inc | $42,800 | None Available |
Source: Public Records
Mortgage History
| Date | Status | Borrower | Loan Amount |
|---|---|---|---|
| Open | Mcintosh Tracy E | $29,520 | |
| Previous Owner | Biddle Cory | $34,865 |
Source: Public Records
Tax History Compared to Growth
Tax History
| Year | Tax Paid | Tax Assessment Tax Assessment Total Assessment is a certain percentage of the fair market value that is determined by local assessors to be the total taxable value of land and additions on the property. | Land | Improvement |
|---|---|---|---|---|
| 2024 | $1,426 | $26,900 | $2,450 | $24,450 |
| 2023 | $1,417 | $26,900 | $2,450 | $24,450 |
| 2022 | $1,102 | $18,480 | $2,450 | $16,030 |
| 2021 | $1,060 | $18,480 | $2,450 | $16,030 |
| 2020 | $1,104 | $18,480 | $2,450 | $16,030 |
| 2019 | $911 | $12,570 | $2,450 | $10,120 |
| 2018 | $814 | $12,570 | $2,450 | $10,120 |
| 2017 | $816 | $12,570 | $2,450 | $10,120 |
| 2016 | $852 | $12,570 | $2,450 | $10,120 |
| 2015 | $817 | $12,570 | $2,450 | $10,120 |
| 2014 | $900 | $14,690 | $2,450 | $12,240 |
| 2013 | $900 | $15,060 | $5,600 | $9,460 |
Source: Public Records
Map
Nearby Homes
- 4530 Shawnray Dr Unit 78
- 4530 Shawnray Dr
- 4524 Shawnray Dr Unit 21
- 1508 Johns Rd
- 4531 Bonita Dr
- 1700 Johns Rd
- 1318 S Breiel Blvd
- 1901 Kenway Place
- 4205 Helton Dr
- 2014 S Breiel Blvd Unit 2014
- 4204 Roosevelt Blvd
- 4610 Carroll Lee Ln
- 4617 Timber Trail Dr
- 2215 Wellington Rd
- 3708 Greenwood Dr
- 3717 Ellis Way
- 800 Dover Ave
- 1926 Circle Kelly Jo
- 4513 Hannah Dr
- 1619 Carriage St
- 4516 Shawnray Dr Unit 44
- 4516 Shawnray Dr
- 4516 Shawnray Dr
- 4516 Shawnray Dr
- 4516 Shawnray Dr
- 4516 Shawnray Dr Unit 38
- 4516 Shawnray Dr
- 4516 Shawnray Dr
- 4516 Shawnray Dr Unit 41
- 4516 Shawnray Dr Unit 39
- 4516 Shawnray Dr Unit 42
- 4510 Shawnray Dr Unit 52
- 4510 Shawnray Dr Unit 51
- 4510 Shawnray Dr
- 4510 Shawnray Dr Unit 49
- 4510 Shawnray Dr Unit 48
- 4510 Shawnray Dr Unit 47
- 4510 Shawnray Dr Unit 46
- 4510 Shawnray Dr
- 4510 Shawnray Dr Unit 50