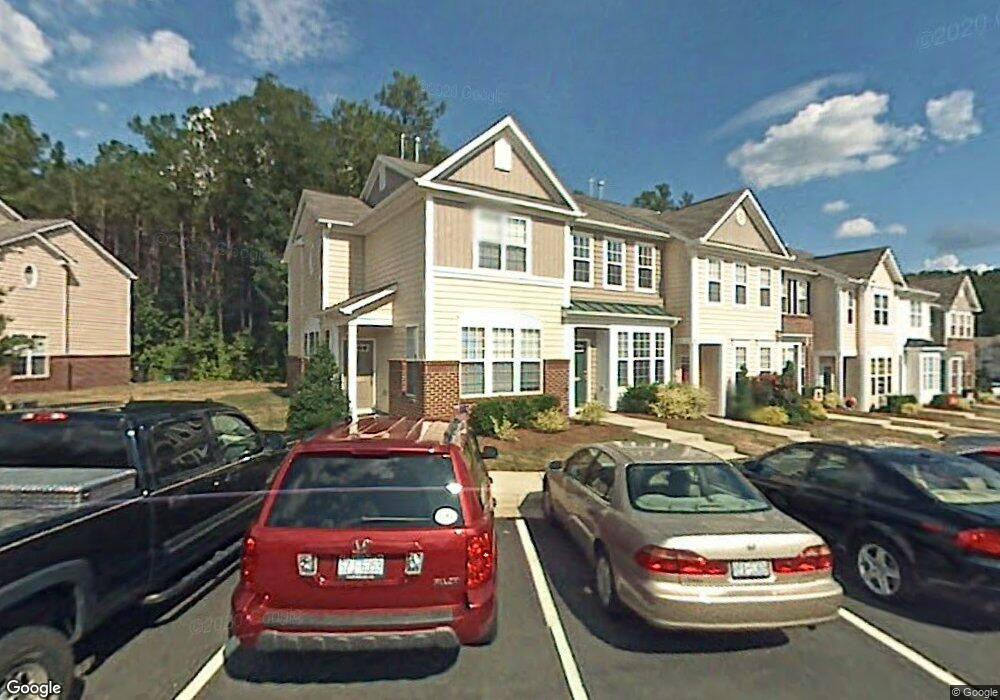
4516 Sugarbend Way Raleigh, NC 27606
South Raleigh NeighborhoodEstimated Value: $315,000 - $320,000
2
Beds
3
Baths
1,297
Sq Ft
$245/Sq Ft
Est. Value
About This Home
This home is located at 4516 Sugarbend Way, Raleigh, NC 27606 and is currently estimated at $318,379, approximately $245 per square foot. 4516 Sugarbend Way is a home located in Wake County with nearby schools including Dillard Drive Magnet Elementary School, Dillard Drive Magnet Middle School, and Adventist Christian Academy of Raleigh.
Ownership History
Date
Name
Owned For
Owner Type
Purchase Details
Closed on
May 18, 2017
Sold by
Gallo Casey M and Gallo Kathy
Bought by
Rodgers Stephanie
Current Estimated Value
Home Financials for this Owner
Home Financials are based on the most recent Mortgage that was taken out on this home.
Original Mortgage
$153,935
Outstanding Balance
$128,016
Interest Rate
4.1%
Mortgage Type
New Conventional
Estimated Equity
$190,363
Purchase Details
Closed on
May 29, 2006
Sold by
Worsley Beth
Bought by
Gallo Casey M
Home Financials for this Owner
Home Financials are based on the most recent Mortgage that was taken out on this home.
Original Mortgage
$136,360
Interest Rate
6.41%
Mortgage Type
FHA
Purchase Details
Closed on
Oct 28, 2004
Sold by
Westfield Homes Of The Carolinas Llc
Bought by
Worsley Beth
Home Financials for this Owner
Home Financials are based on the most recent Mortgage that was taken out on this home.
Original Mortgage
$90,192
Interest Rate
4.75%
Mortgage Type
Unknown
Create a Home Valuation Report for This Property
The Home Valuation Report is an in-depth analysis detailing your home's value as well as a comparison with similar homes in the area
Home Values in the Area
Average Home Value in this Area
Purchase History
| Date | Buyer | Sale Price | Title Company |
|---|---|---|---|
| Rodgers Stephanie | $181,500 | None Available | |
| Gallo Casey M | $139,000 | None Available | |
| Worsley Beth | $113,000 | -- |
Source: Public Records
Mortgage History
| Date | Status | Borrower | Loan Amount |
|---|---|---|---|
| Open | Rodgers Stephanie | $153,935 | |
| Previous Owner | Gallo Casey M | $136,360 | |
| Previous Owner | Worsley Beth | $90,192 | |
| Closed | Worsley Beth | $22,548 |
Source: Public Records
Tax History Compared to Growth
Tax History
| Year | Tax Paid | Tax Assessment Tax Assessment Total Assessment is a certain percentage of the fair market value that is determined by local assessors to be the total taxable value of land and additions on the property. | Land | Improvement |
|---|---|---|---|---|
| 2025 | $2,622 | $298,352 | $90,000 | $208,352 |
| 2024 | $2,611 | $298,352 | $90,000 | $208,352 |
| 2023 | $2,208 | $200,738 | $45,000 | $155,738 |
| 2022 | $2,052 | $200,738 | $45,000 | $155,738 |
| 2021 | $1,973 | $200,738 | $45,000 | $155,738 |
| 2020 | $1,937 | $200,738 | $45,000 | $155,738 |
| 2019 | $1,725 | $147,115 | $32,000 | $115,115 |
| 2018 | $1,627 | $147,115 | $32,000 | $115,115 |
| 2017 | $1,550 | $147,115 | $32,000 | $115,115 |
| 2016 | $1,519 | $147,115 | $32,000 | $115,115 |
| 2015 | $1,604 | $152,977 | $32,000 | $120,977 |
| 2014 | $1,522 | $152,977 | $32,000 | $120,977 |
Source: Public Records
Map
Nearby Homes
- 4510 Sugarbend Way
- 4536 Sugarbend Way
- 5318 Crescentview Pkwy
- 5229 Moonview Ct
- 5407 Crescentview Pkwy
- 4502 Pale Moss Dr
- 4511 Pale Moss Dr
- 4513 Pale Moss Dr
- 4538 Pale Moss Dr
- 5569 Sea Daisy Dr
- 4421 Bridle Run Dr
- 5322 Goldenglow Way
- 4017 Tryon Rd
- 4640 Asterwood Dr
- 3977 Amelia Park Dr
- 5333 Olive Rd
- 5228 Olive Rd
- 2432 Baileys Landing Dr
- 2505 Goldeneye Ct
- 5119 Orabelle Ct
- 4514 Sugarbend Way
- 4512 Sugarbend Way
- 4518 Sugarbend Way
- 4508 Sugarbend Way
- 4506 Sugarbend Way
- 4504 Sugarbend Way
- 4524 Sugarbend Way
- 4526 Sugarbend Way
- 5305 Crescentview Pkwy
- 4430 Sugarbend Way
- 4528 Sugarbend Way
- 5307 Crescentview Pkwy
- 4530 Sugarbend Way
- 5302 Silver Moon Ln
- 4428 Sugarbend Way
- 5309 Crescentview Pkwy
- 4426 Sugarbend Way
- 4532 Sugarbend Way
- 5304 Silver Moon Ln
- 5311 Crescentview Pkwy