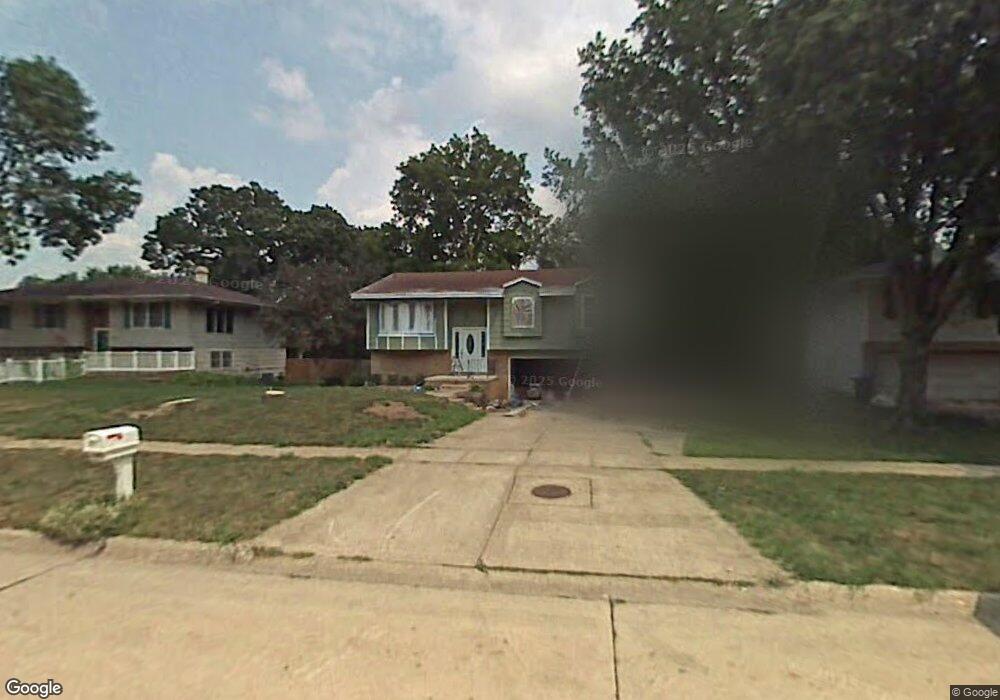
4517 68th St Urbandale, IA 50322
Estimated Value: $265,407 - $283,000
3
Beds
2
Baths
1,074
Sq Ft
$253/Sq Ft
Est. Value
About This Home
This home is located at 4517 68th St, Urbandale, IA 50322 and is currently estimated at $272,102, approximately $253 per square foot. 4517 68th St is a home located in Polk County with nearby schools including Urbandale Middle School, Urbandale High School, and St Pius X School.
Ownership History
Date
Name
Owned For
Owner Type
Purchase Details
Closed on
Aug 19, 2025
Sold by
Cowger Bradley L and Cowger Brad
Bought by
Seaman Paul and Seaman Jessica
Current Estimated Value
Purchase Details
Closed on
Feb 3, 2016
Sold by
Cowger Leslie A
Bought by
Cowger Bradley
Purchase Details
Closed on
May 9, 2006
Sold by
Wisecup Bylle M
Bought by
Cowger Brad and Nelson Leslie
Home Financials for this Owner
Home Financials are based on the most recent Mortgage that was taken out on this home.
Original Mortgage
$147,500
Outstanding Balance
$86,108
Interest Rate
6.54%
Mortgage Type
Fannie Mae Freddie Mac
Estimated Equity
$185,994
Create a Home Valuation Report for This Property
The Home Valuation Report is an in-depth analysis detailing your home's value as well as a comparison with similar homes in the area
Home Values in the Area
Average Home Value in this Area
Purchase History
| Date | Buyer | Sale Price | Title Company |
|---|---|---|---|
| Seaman Paul | $260,500 | None Listed On Document | |
| Seaman Paul | $260,500 | None Listed On Document | |
| Cowger Bradley | -- | None Available | |
| Cowger Brad | $147,000 | Itc |
Source: Public Records
Mortgage History
| Date | Status | Borrower | Loan Amount |
|---|---|---|---|
| Open | Cowger Brad | $147,500 |
Source: Public Records
Tax History Compared to Growth
Tax History
| Year | Tax Paid | Tax Assessment Tax Assessment Total Assessment is a certain percentage of the fair market value that is determined by local assessors to be the total taxable value of land and additions on the property. | Land | Improvement |
|---|---|---|---|---|
| 2025 | $4,864 | $282,600 | $62,000 | $220,600 |
| 2024 | $4,864 | $268,500 | $58,000 | $210,500 |
| 2023 | $4,598 | $268,500 | $58,000 | $210,500 |
| 2022 | $4,546 | $214,300 | $47,400 | $166,900 |
| 2021 | $4,392 | $214,300 | $47,400 | $166,900 |
| 2020 | $4,318 | $196,600 | $43,500 | $153,100 |
| 2019 | $4,124 | $196,600 | $43,500 | $153,100 |
| 2018 | $3,974 | $179,300 | $38,800 | $140,500 |
| 2017 | $3,668 | $179,300 | $38,800 | $140,500 |
| 2016 | $3,578 | $162,700 | $35,200 | $127,500 |
| 2015 | $3,578 | $162,700 | $35,200 | $127,500 |
| 2014 | $3,354 | $157,300 | $33,400 | $123,900 |
Source: Public Records
Map
Nearby Homes