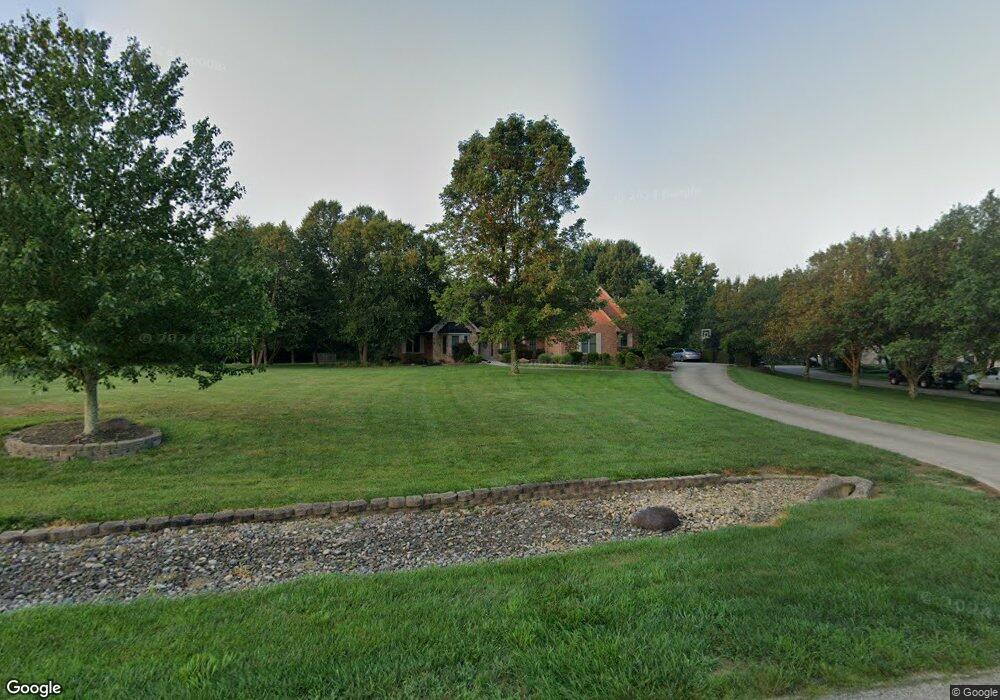
4517 Cedar Hill Dr Batavia, OH 45103
Estimated Value: $602,000 - $790,000
4
Beds
2
Baths
3,080
Sq Ft
$219/Sq Ft
Est. Value
About This Home
This home is located at 4517 Cedar Hill Dr, Batavia, OH 45103 and is currently estimated at $673,305, approximately $218 per square foot. 4517 Cedar Hill Dr is a home located in Clermont County with nearby schools including Clermont Northeastern Elementary School, Clermont Northeastern Middle School, and Clermont Northeastern High School.
Ownership History
Date
Name
Owned For
Owner Type
Purchase Details
Closed on
Apr 10, 2021
Sold by
Sunderman Christina Marie and Sunderman Steven
Bought by
Sunderman Christina Marie and Sunderman Steven
Current Estimated Value
Home Financials for this Owner
Home Financials are based on the most recent Mortgage that was taken out on this home.
Original Mortgage
$281,338
Outstanding Balance
$233,049
Interest Rate
3.05%
Mortgage Type
FHA
Estimated Equity
$440,256
Purchase Details
Closed on
Sep 21, 2011
Sold by
Lammers Jenna
Bought by
Federal Home Loan Mortgage Corporation
Purchase Details
Closed on
Sep 26, 2007
Sold by
Cain Kari and Cain Greg
Bought by
Lammers Jenna and Lammers Dylan
Home Financials for this Owner
Home Financials are based on the most recent Mortgage that was taken out on this home.
Original Mortgage
$302,800
Interest Rate
6.66%
Mortgage Type
Purchase Money Mortgage
Purchase Details
Closed on
Jul 7, 2003
Sold by
Dfv Inc
Bought by
Cain Greg and Cain Kari
Create a Home Valuation Report for This Property
The Home Valuation Report is an in-depth analysis detailing your home's value as well as a comparison with similar homes in the area
Home Values in the Area
Average Home Value in this Area
Purchase History
| Date | Buyer | Sale Price | Title Company |
|---|---|---|---|
| Sunderman Christina Marie | -- | Mortgage Information Svcs In | |
| Federal Home Loan Mortgage Corporation | $220,000 | None Available | |
| Lammers Jenna | $378,500 | Chase Legal Title | |
| Cain Greg | $72,000 | -- |
Source: Public Records
Mortgage History
| Date | Status | Borrower | Loan Amount |
|---|---|---|---|
| Open | Sunderman Christina Marie | $281,338 | |
| Previous Owner | Lammers Jenna | $302,800 |
Source: Public Records
Tax History Compared to Growth
Tax History
| Year | Tax Paid | Tax Assessment Tax Assessment Total Assessment is a certain percentage of the fair market value that is determined by local assessors to be the total taxable value of land and additions on the property. | Land | Improvement |
|---|---|---|---|---|
| 2024 | $7,165 | $201,670 | $33,600 | $168,070 |
| 2023 | $7,176 | $201,670 | $33,600 | $168,070 |
| 2022 | $5,858 | $151,140 | $25,170 | $125,970 |
| 2021 | $5,871 | $151,140 | $25,170 | $125,970 |
| 2020 | $5,875 | $151,140 | $25,170 | $125,970 |
| 2019 | $4,527 | $112,600 | $16,630 | $95,970 |
| 2018 | $4,529 | $112,600 | $16,630 | $95,970 |
| 2017 | $4,323 | $112,600 | $16,630 | $95,970 |
| 2016 | $4,323 | $102,380 | $15,120 | $87,260 |
| 2015 | $4,043 | $102,380 | $15,120 | $87,260 |
| 2014 | $4,043 | $102,380 | $15,120 | $87,260 |
| 2013 | $4,370 | $105,990 | $16,000 | $89,990 |
Source: Public Records
Map
Nearby Homes
- 4605 Stanton Hall
- 4843 Benton Rd
- 3340 Dewdrop Way
- 2073 Natchez Trace
- 1 Old St Rt 32
- 2125 Picketside Dr
- 2188 Winemiller Ln
- 4323 Southcross Dr
- 3 Old St Rt 32
- 2155 Commons Circle Dr
- 4282 Hickory Park Ln Unit 51
- 263 W Charles St
- 247 R Bridgewater Dr
- 251 #R Bridgewater Dr
- 2532 Streamside Dr
- 5000 Ohio 132
- Bridgewater Dr
- 5025 St Rt 132
- 179 N 6th St
- 3138 Parkside Dr
- 1 Cedar Hill Dr
- 4513 Cedar Hill Dr
- 4510 Cedar Hill Dr
- 1.25ac Cedar Hill Dr
- 4509 Cedar Hill Dr
- 4530 Cedar Hill Dr
- 4547 Cedar Hill Dr
- 4500 Cedar Hill Dr
- 4505 Cedar Hill Dr
- 4540 Cedar Hill Dr
- lot Cedar Hill Dr
- 4551 Cedar Hill Dr
- 4558 Ohio 132
- 4558 State Route 132
- 4525 Cedar Hill Dr
- 4546 State Route 132
- 4550 Cedar Hill Dr
- 4561 Ohio 132
- 4555 State Route 132
- 4545 State Route 132