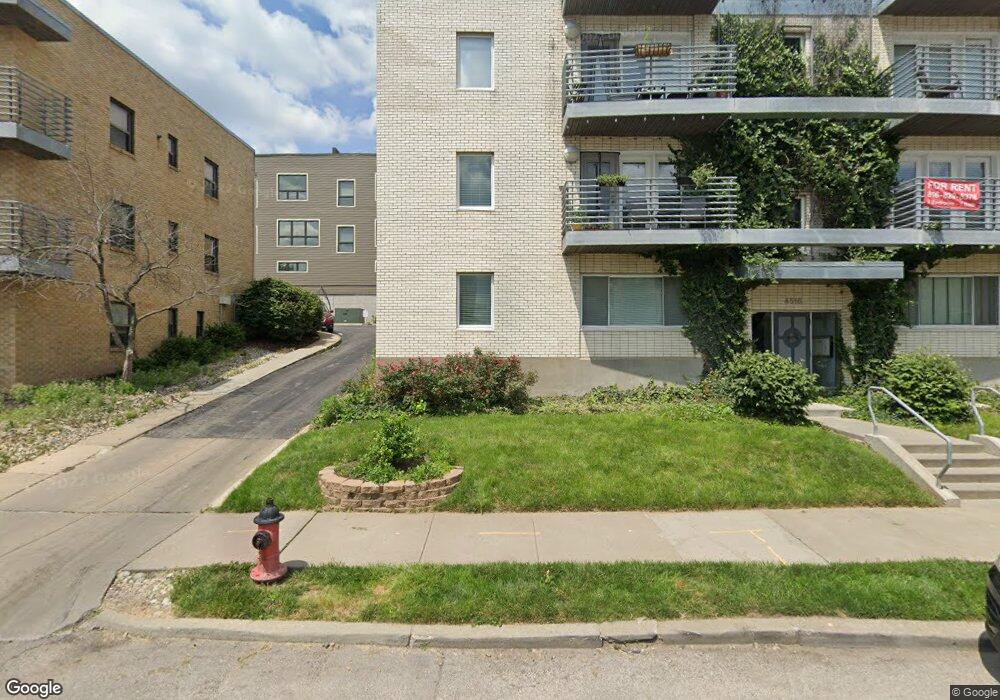
4518 Broadway St Unit 3D Kansas City, MO 64111
Plaza Westport NeighborhoodEstimated Value: $208,000 - $227,497
2
Beds
1
Bath
739
Sq Ft
$292/Sq Ft
Est. Value
About This Home
This home is located at 4518 Broadway St Unit 3D, Kansas City, MO 64111 and is currently estimated at $216,124, approximately $292 per square foot. 4518 Broadway St Unit 3D is a home located in Jackson County with nearby schools including Central Middle School, Central High School, and Allen Village Primary.
Ownership History
Date
Name
Owned For
Owner Type
Purchase Details
Closed on
Jan 26, 2024
Sold by
5A Llc
Bought by
Roskop Ailie L
Current Estimated Value
Home Financials for this Owner
Home Financials are based on the most recent Mortgage that was taken out on this home.
Original Mortgage
$152,250
Outstanding Balance
$149,000
Interest Rate
5.88%
Mortgage Type
New Conventional
Estimated Equity
$67,124
Purchase Details
Closed on
Feb 18, 2022
Sold by
Mealhall Llc
Bought by
5A Llc
Home Financials for this Owner
Home Financials are based on the most recent Mortgage that was taken out on this home.
Original Mortgage
$850,000
Interest Rate
3.69%
Mortgage Type
New Conventional
Purchase Details
Closed on
Feb 8, 2018
Sold by
Marklind Llc
Bought by
Ahr Invesments Llc
Purchase Details
Closed on
Apr 28, 2008
Sold by
46 Broadway Partners Llc
Bought by
Marklind Llc
Create a Home Valuation Report for This Property
The Home Valuation Report is an in-depth analysis detailing your home's value as well as a comparison with similar homes in the area
Home Values in the Area
Average Home Value in this Area
Purchase History
| Date | Buyer | Sale Price | Title Company |
|---|---|---|---|
| Roskop Ailie L | -- | Platinum Title | |
| 5A Llc | -- | Continental Title | |
| 5A Llc | $1,130,500 | Continental Title | |
| Ahr Invesments Llc | -- | Assured Quality Title Co | |
| Marklind Llc | -- | None Available |
Source: Public Records
Mortgage History
| Date | Status | Borrower | Loan Amount |
|---|---|---|---|
| Open | Roskop Ailie L | $152,250 | |
| Previous Owner | 5A Llc | $850,000 |
Source: Public Records
Tax History Compared to Growth
Tax History
| Year | Tax Paid | Tax Assessment Tax Assessment Total Assessment is a certain percentage of the fair market value that is determined by local assessors to be the total taxable value of land and additions on the property. | Land | Improvement |
|---|---|---|---|---|
| 2025 | $3,106 | $41,564 | $4,104 | $37,460 |
| 2024 | $3,079 | $36,144 | $11,085 | $25,059 |
| 2023 | $3,079 | $36,144 | $4,017 | $32,127 |
| 2022 | $3,358 | $37,620 | $1,892 | $35,728 |
| 2021 | $3,347 | $37,620 | $1,892 | $35,728 |
| 2020 | $2,728 | $32,865 | $1,892 | $30,973 |
| 2019 | $2,672 | $32,865 | $1,892 | $30,973 |
| 2018 | $1,762,054 | $25,071 | $1,892 | $23,179 |
| 2017 | $1,996 | $25,071 | $1,892 | $23,179 |
| 2016 | $1,977 | $24,700 | $1,892 | $22,808 |
| 2014 | $2,197 | $27,360 | $1,892 | $25,468 |
Source: Public Records
Map
Nearby Homes
- 4540 Broadway St Unit 3S
- 4540 Broadway Blvd Unit 3N
- 411 W 46th Terrace Unit 202
- 4545 Wornall Rd Unit 605
- 4545 Wornall Rd Unit 708
- 4545 Wornall Rd Unit LE1
- 4545 Wornall Rd Unit 1009
- 4545 Wornall Rd Unit 208
- 4545 Wornall Rd Unit 507
- 4545 Wornall Rd Unit 1210
- 4545 Wornall Rd
- 4528 Mill Creek Pkwy
- 4463 Jefferson St
- 732 W 45th St
- 4450 Summit St
- 4555 Main St Unit 205
- 4555 Main #204 St Unit 204
- 732 Corbin Terrace
- 700 W 48th St Unit 301
- 229 Ward Pkwy Unit 503A
- 4516 Broadway
- 4516 Broadway
- 4516 Broadway
- 4516 Broadway
- 4516 Broadway
- 4516 Broadway
- 4516 Broadway Unit 304
- 4518 Broadway St Unit 3A
- 4518 Broadway St Unit 2A
- 4518 Broadway St Unit 2D
- 4518 Broadway St Unit 1A
- 4516 Broadway Unit 104
- 4516 Broadway
- 4516 Broadway Unit 302
- 4516 Broadway Blvd Unit 1A
- 4516 Broadway Blvd Unit 202
- 4516 Broadway
- 4516 Broadway
- 4516 Broadway
- 4516 Broadway