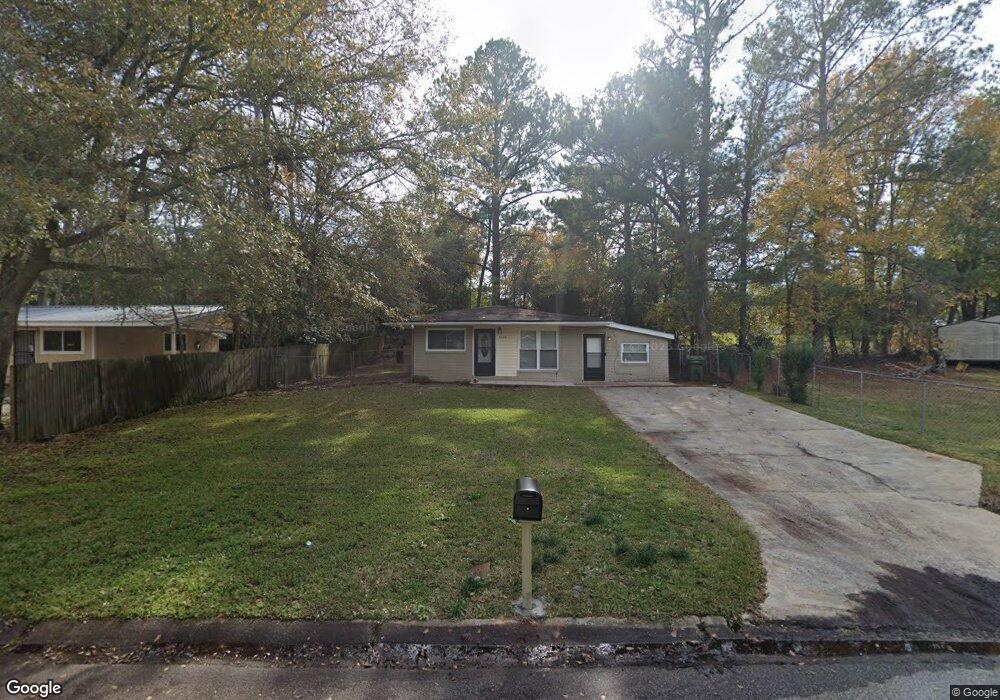
4518 Estonia St Columbus, GA 31907
Eastern Columbus NeighborhoodEstimated Value: $89,000 - $126,000
3
Beds
2
Baths
1,128
Sq Ft
$94/Sq Ft
Est. Value
About This Home
This home is located at 4518 Estonia St, Columbus, GA 31907 and is currently estimated at $105,965, approximately $93 per square foot. 4518 Estonia St is a home located in Muscogee County with nearby schools including St. Mary's Road Magnet Academy, Rothschild Leadership Academy, and Kendrick High School.
Ownership History
Date
Name
Owned For
Owner Type
Purchase Details
Closed on
Oct 28, 2014
Sold by
Walton Felix
Bought by
Tw5 Llc
Current Estimated Value
Purchase Details
Closed on
Oct 17, 2014
Sold by
Sec Of Housing & U
Bought by
Walton Felix
Purchase Details
Closed on
Apr 1, 2014
Sold by
Georgia Housing & Financ
Bought by
Sec Of Housing & Urban Dev O
Purchase Details
Closed on
Oct 26, 2010
Sold by
Hall Larry
Bought by
Lindsey Sharmara N
Home Financials for this Owner
Home Financials are based on the most recent Mortgage that was taken out on this home.
Original Mortgage
$48,972
Interest Rate
4.62%
Mortgage Type
FHA
Purchase Details
Closed on
Aug 20, 2009
Sold by
The Bank Of New York Mellon Trust Compan
Bought by
Hall Larry
Purchase Details
Closed on
Aug 5, 2008
Sold by
Person Lora Anne
Bought by
The Bank Of New York Natl Trust Co Na and Jpmorgan Chase Bank Na
Create a Home Valuation Report for This Property
The Home Valuation Report is an in-depth analysis detailing your home's value as well as a comparison with similar homes in the area
Home Values in the Area
Average Home Value in this Area
Purchase History
| Date | Buyer | Sale Price | Title Company |
|---|---|---|---|
| Tw5 Llc | -- | -- | |
| Walton Felix | $26,500 | -- | |
| Sec Of Housing & Urban Dev O | $50,381 | -- | |
| Georgia Housing & Finance Au | $50,381 | -- | |
| Lindsey Sharmara N | $59,900 | None Available | |
| Hall Larry | $21,700 | None Available | |
| The Bank Of New York Natl Trust Co Na | $45,265 | None Available |
Source: Public Records
Mortgage History
| Date | Status | Borrower | Loan Amount |
|---|---|---|---|
| Previous Owner | Lindsey Sharmara N | $48,972 |
Source: Public Records
Tax History Compared to Growth
Tax History
| Year | Tax Paid | Tax Assessment Tax Assessment Total Assessment is a certain percentage of the fair market value that is determined by local assessors to be the total taxable value of land and additions on the property. | Land | Improvement |
|---|---|---|---|---|
| 2025 | $113 | $28,788 | $5,976 | $22,812 |
| 2024 | $113 | $28,788 | $5,976 | $22,812 |
| 2023 | $1,134 | $28,788 | $5,976 | $22,812 |
| 2022 | $978 | $23,960 | $5,976 | $17,984 |
| 2021 | $929 | $22,760 | $5,976 | $16,784 |
| 2020 | $930 | $22,760 | $5,976 | $16,784 |
| 2019 | $933 | $22,760 | $5,976 | $16,784 |
| 2018 | $933 | $22,760 | $5,976 | $16,784 |
| 2017 | $935 | $22,760 | $5,976 | $16,784 |
| 2016 | $893 | $21,660 | $3,669 | $17,991 |
| 2015 | $175 | $10,600 | $3,669 | $6,931 |
| 2014 | $373 | $22,527 | $3,669 | $18,858 |
| 2013 | -- | $22,527 | $3,669 | $18,858 |
Source: Public Records
Map
Nearby Homes
- 4414 Curry St
- 392 Olsen Ave
- 4534 Sentry St
- 391 & 401 Victoria Dr
- 410 McCartha Dr
- 4801 Allen St
- 418 Henson Ave
- 4422 Pate Dr
- 4516 Sims St
- 4846 Maplewood Dr
- 4437 St Marys Rd
- 533 Englewood Dr
- 5003 Shirley Ann Dr
- 5021 Shirley Ann Dr
- 4459 Bermuda St
- 636 Dogwood Dr
- 4930 Capricorn Ct
- 59 Apollo Dr
- 3943 Curry St
- 644 Georgia Dr
- 4526 Estonia St
- 228 Braselman Ave
- 234 Braselman Ave
- 4532 Estonia St
- 4517 Timothy St
- 4523 Timothy St
- 4513 Timothy St
- 4519 Estonia St
- 4538 Estonia St
- 4513 Estonia St
- 4525 Estonia St
- 4507 Estonia St
- 4531 Estonia St
- 4535 Timothy St
- 4550 Estonia St
- 4501 Estonia St
- 4537 Estonia St
- 210 Braselman Ave
- 227 Braselman Ave
- 4541 Timothy St