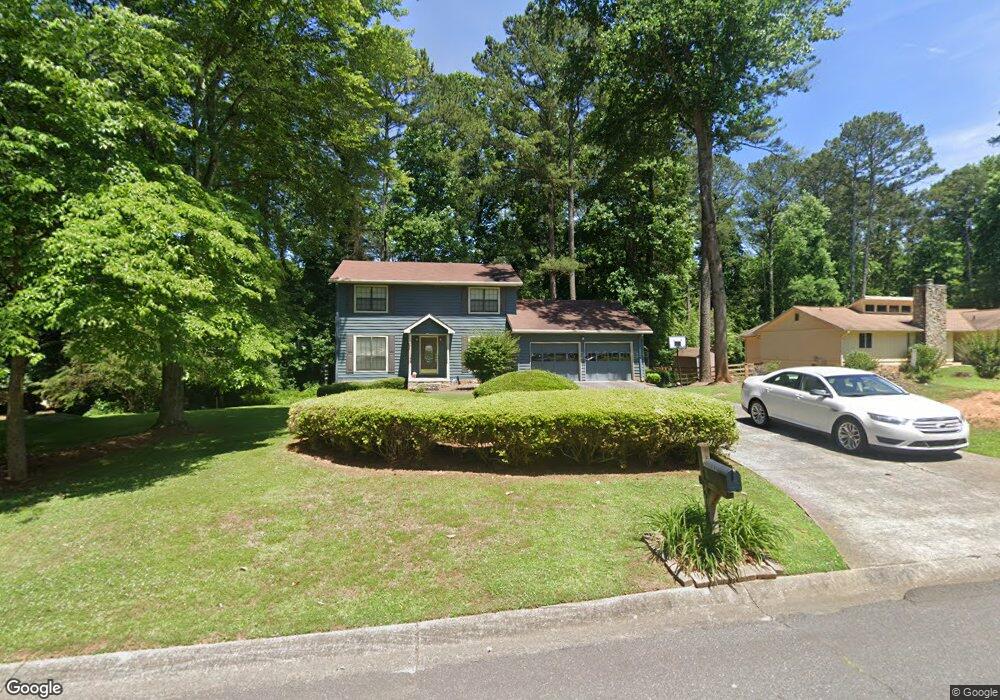
4518 N Landing Dr Unit 4 Marietta, GA 30066
Sandy Plains NeighborhoodEstimated Value: $392,000 - $400,282
3
Beds
2
Baths
1,697
Sq Ft
$234/Sq Ft
Est. Value
About This Home
This home is located at 4518 N Landing Dr Unit 4, Marietta, GA 30066 and is currently estimated at $396,321, approximately $233 per square foot. 4518 N Landing Dr Unit 4 is a home located in Cobb County with nearby schools including Keheley Elementary School and McCleskey Middle School.
Ownership History
Date
Name
Owned For
Owner Type
Purchase Details
Closed on
Mar 30, 2004
Sold by
Wentz James J and Wentz Angela F
Bought by
Teague Keith N and Teague William
Current Estimated Value
Home Financials for this Owner
Home Financials are based on the most recent Mortgage that was taken out on this home.
Original Mortgage
$165,000
Outstanding Balance
$76,465
Interest Rate
5.55%
Mortgage Type
New Conventional
Estimated Equity
$319,856
Purchase Details
Closed on
Aug 30, 1999
Sold by
Barthel John D and Barthel Deborah S
Bought by
Wentz James J and Wentz Angela F
Home Financials for this Owner
Home Financials are based on the most recent Mortgage that was taken out on this home.
Original Mortgage
$121,050
Interest Rate
7.91%
Mortgage Type
New Conventional
Create a Home Valuation Report for This Property
The Home Valuation Report is an in-depth analysis detailing your home's value as well as a comparison with similar homes in the area
Home Values in the Area
Average Home Value in this Area
Purchase History
| Date | Buyer | Sale Price | Title Company |
|---|---|---|---|
| Teague Keith N | $175,000 | -- | |
| Wentz James J | $134,500 | -- |
Source: Public Records
Mortgage History
| Date | Status | Borrower | Loan Amount |
|---|---|---|---|
| Open | Teague Keith N | $165,000 | |
| Previous Owner | Wentz James J | $121,050 |
Source: Public Records
Tax History Compared to Growth
Tax History
| Year | Tax Paid | Tax Assessment Tax Assessment Total Assessment is a certain percentage of the fair market value that is determined by local assessors to be the total taxable value of land and additions on the property. | Land | Improvement |
|---|---|---|---|---|
| 2025 | $3,075 | $132,120 | $36,000 | $96,120 |
| 2024 | $3,077 | $132,120 | $36,000 | $96,120 |
| 2023 | $2,814 | $144,980 | $36,000 | $108,980 |
| 2022 | $2,815 | $119,036 | $26,000 | $93,036 |
| 2021 | $2,274 | $94,292 | $24,000 | $70,292 |
| 2020 | $2,274 | $94,292 | $24,000 | $70,292 |
| 2019 | $2,120 | $87,280 | $18,400 | $68,880 |
| 2018 | $1,902 | $77,324 | $18,400 | $58,924 |
| 2017 | $1,768 | $74,488 | $18,400 | $56,088 |
| 2016 | $1,493 | $61,936 | $17,200 | $44,736 |
| 2015 | $1,517 | $61,364 | $12,000 | $49,364 |
| 2014 | $1,530 | $61,364 | $0 | $0 |
Source: Public Records
Map
Nearby Homes
- 4509 N Landing Dr
- 4509 N Bay Ct
- 4592 N Landing Dr
- 4797 North Trail
- 4799 North Trail
- 4709 Trickum Rd NE
- 1765 Blackwillow Dr
- 4499 Browning Ct NE
- 4813 Highpoint Dr NE
- 4314 Keheley Lake Ct NE
- 2256 Turtle Club Dr NE Unit 1
- 4924 Locklear Way
- 4281 Keheley Lake Dr NE
- 1634 Barrier Rd
- 5009 Kingsley Manor Ct
- 4758 Jamerson Forest Cir
- 4181 Keheley Dr NE
- 4510 N Landing Dr
- 2030 N Cove Ct Unit 4
- 2022 N Cove Ct
- 2026 N Cove Ct Unit 4A
- 4517 N Landing Dr
- 2081 Kemp Rd
- N N Cove Ct
- 4502 N Landing Dr
- 2034 N Cove Ct
- 20037 N Cove Ct
- 2037 N Cove Ct
- 2091 Kemp Rd
- 4501 N Landing Dr
- 4501 N Landing Dr
- 4501 N Landing Dr Unit 4B
- 2010 N Cove Ct Unit 4B
- 2025 N Cove Ct Unit 4
- 2033 N Cove Ct
- 2029 N Cove Ct
- 2013 N Cove Ct