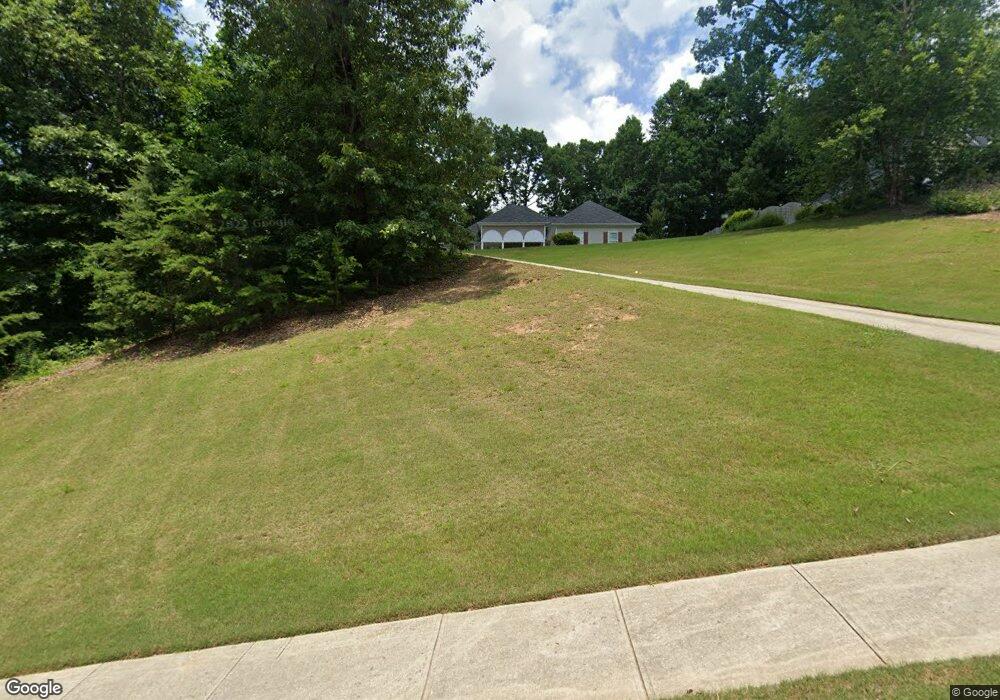
4518 Old Princeton Ridge Unit 3 Gainesville, GA 30506
Estimated Value: $382,000 - $410,000
3
Beds
2
Baths
1,681
Sq Ft
$235/Sq Ft
Est. Value
About This Home
This home is located at 4518 Old Princeton Ridge Unit 3, Gainesville, GA 30506 and is currently estimated at $394,212, approximately $234 per square foot. 4518 Old Princeton Ridge Unit 3 is a home located in Hall County with nearby schools including Lanier Elementary School, Chestatee Middle School, and Chestatee High School.
Ownership History
Date
Name
Owned For
Owner Type
Purchase Details
Closed on
Oct 17, 2008
Sold by
Federal National Mortgage Association
Bought by
Williams Mary O
Current Estimated Value
Home Financials for this Owner
Home Financials are based on the most recent Mortgage that was taken out on this home.
Original Mortgage
$153,300
Outstanding Balance
$97,860
Interest Rate
5.78%
Mortgage Type
FHA
Estimated Equity
$296,352
Purchase Details
Closed on
Jan 2, 2008
Sold by
Franklin April
Bought by
Federal National Mortgage Association
Purchase Details
Closed on
Aug 2, 2006
Sold by
Eddie Wheeler Construction Inc
Bought by
Franklin April
Home Financials for this Owner
Home Financials are based on the most recent Mortgage that was taken out on this home.
Original Mortgage
$212,000
Interest Rate
6.74%
Mortgage Type
New Conventional
Purchase Details
Closed on
Sep 16, 2004
Sold by
Highway 53 Properties Inc
Bought by
Dc&L Sardis Llc
Create a Home Valuation Report for This Property
The Home Valuation Report is an in-depth analysis detailing your home's value as well as a comparison with similar homes in the area
Home Values in the Area
Average Home Value in this Area
Purchase History
| Date | Buyer | Sale Price | Title Company |
|---|---|---|---|
| Williams Mary O | -- | -- | |
| Federal National Mortgage Association | $177,851 | -- | |
| Federal National Mortgage Association | $177,900 | -- | |
| Franklin April | $212,000 | -- | |
| Dc&L Sardis Llc | $806,200 | -- |
Source: Public Records
Mortgage History
| Date | Status | Borrower | Loan Amount |
|---|---|---|---|
| Open | Williams Mary O | $153,300 | |
| Previous Owner | Franklin April | $212,000 |
Source: Public Records
Tax History Compared to Growth
Tax History
| Year | Tax Paid | Tax Assessment Tax Assessment Total Assessment is a certain percentage of the fair market value that is determined by local assessors to be the total taxable value of land and additions on the property. | Land | Improvement |
|---|---|---|---|---|
| 2025 | $1,255 | $149,040 | $21,520 | $127,520 |
| 2024 | $1,383 | $155,160 | $26,520 | $128,640 |
| 2023 | $1,227 | $147,240 | $28,640 | $118,600 |
| 2022 | $1,340 | $136,600 | $28,040 | $108,560 |
| 2021 | $1,044 | $97,280 | $12,240 | $85,040 |
| 2020 | $1,023 | $93,000 | $12,240 | $80,760 |
| 2019 | $989 | $87,320 | $12,240 | $75,080 |
| 2018 | $928 | $79,080 | $10,200 | $68,880 |
| 2017 | $1,569 | $71,160 | $10,200 | $60,960 |
| 2016 | $1,515 | $71,160 | $10,200 | $60,960 |
| 2015 | $1,883 | $65,920 | $8,160 | $57,760 |
| 2014 | $1,883 | $64,360 | $6,600 | $57,760 |
Source: Public Records
Map
Nearby Homes
- 4522 Old Princeton Ridge
- 4506 Old Princeton Ridge Unit 1
- 4765 Warwick Dr
- 4528 Hoskins Dr
- 4363 Sardis Rd
- 4704 Hanson Hills Ct
- 4135 Cha Co Rd
- 4340 Oak Creek Dr
- 4466 Sardis Dr
- 3286 High View Ct
- 3292 High View Ct
- 3834 Covered Bridge Place
- 4123 Leach Rd
- 4719 Giddon Martin Rd
- 3955 Hidden Hollow Dr
- 4033 Hidden Hollow Dr
- 5014 Red Oak Ln
- 4107 Belvedere Dr
- 4114 Belvedere Dr
- 4312 Green Hill Rd
- 4514 Old Princeton Ridge Unit 3
- 4522 Old Princeton Ridge Unit 20
- 4510 Old Princeton Ridge
- 4526 Old Princeton Ridge
- 4519 Old Princeton Ridge
- 4519 Princeton Ridge
- 4515 Old Princeton Ridge
- 4523 Old Princeton Ridge
- 4511 Old Princeton Ridge
- 4602 Old Princeton Ridge
- 4507 Old Princeton Ridge Unit 1
- 4605 Wakefield Ln Unit 34
- 4527 Old Princeton Ridge
- 4605 Wakefield Ln
- 4527 Old Princeton Ridge Unit 34
- 4502 Old Princeton Ridge
- 4606 Old Princeton Ridge
- 4406 Enfield Dr Unit 1
- 4603 Old Princeton Ridge
- 4615 Wakefield Ln