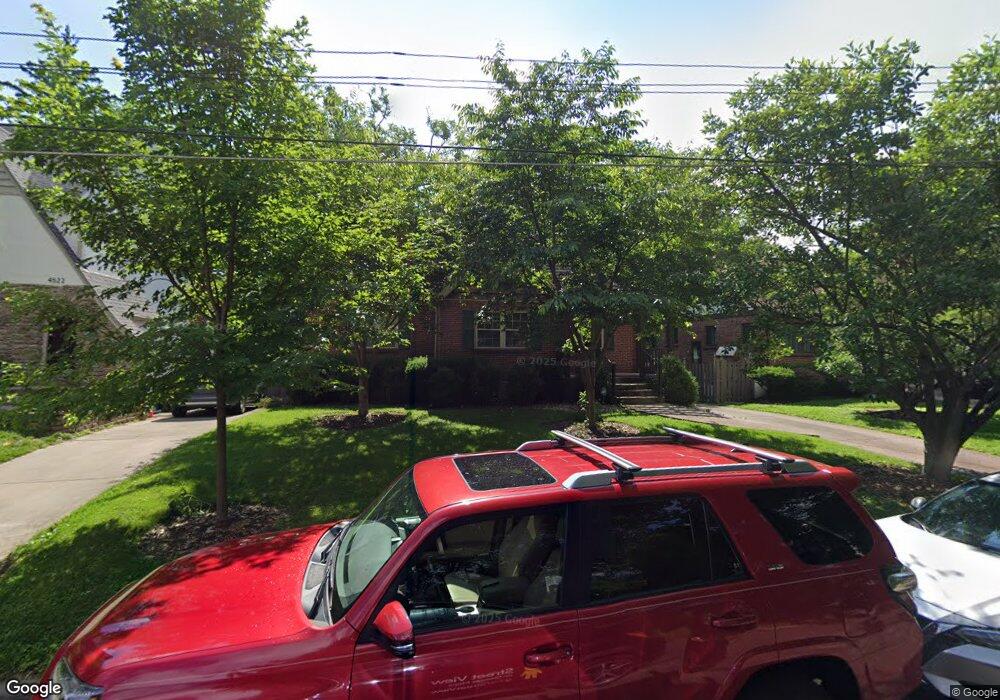
4518 Perth Ln Cincinnati, OH 45229
Paddock Hills NeighborhoodEstimated Value: $240,000 - $362,000
2
Beds
3
Baths
1,252
Sq Ft
$227/Sq Ft
Est. Value
About This Home
This home is located at 4518 Perth Ln, Cincinnati, OH 45229 and is currently estimated at $284,430, approximately $227 per square foot. 4518 Perth Ln is a home located in Hamilton County with nearby schools including Bond Hill Academy Elementary School, Shroder High School, and Clark Montessori High School.
Ownership History
Date
Name
Owned For
Owner Type
Purchase Details
Closed on
Jul 31, 2003
Sold by
Inskeep Kimberly L
Bought by
Woerner Craig A and Looney Tammie D
Current Estimated Value
Home Financials for this Owner
Home Financials are based on the most recent Mortgage that was taken out on this home.
Original Mortgage
$127,300
Outstanding Balance
$53,562
Interest Rate
5.47%
Mortgage Type
Unknown
Estimated Equity
$230,868
Purchase Details
Closed on
Nov 16, 1999
Sold by
Estate Of Dexter Curtis Adams
Bought by
Adams Angela A
Purchase Details
Closed on
Dec 14, 1993
Sold by
Procter & Gamble Company
Bought by
Inskeep James A and Inskeep Kimberly L
Home Financials for this Owner
Home Financials are based on the most recent Mortgage that was taken out on this home.
Original Mortgage
$103,250
Interest Rate
7.26%
Mortgage Type
FHA
Purchase Details
Closed on
Sep 1, 1993
Sold by
Ross Marc S and Ross Ilene S
Bought by
The Procter & Gamble Company
Create a Home Valuation Report for This Property
The Home Valuation Report is an in-depth analysis detailing your home's value as well as a comparison with similar homes in the area
Home Values in the Area
Average Home Value in this Area
Purchase History
| Date | Buyer | Sale Price | Title Company |
|---|---|---|---|
| Woerner Craig A | $134,000 | Classic Title Agency Inc | |
| Adams Angela A | -- | -- | |
| Inskeep James A | -- | -- | |
| The Procter & Gamble Company | -- | -- |
Source: Public Records
Mortgage History
| Date | Status | Borrower | Loan Amount |
|---|---|---|---|
| Open | Woerner Craig A | $127,300 | |
| Previous Owner | Inskeep James A | $103,250 |
Source: Public Records
Tax History
| Year | Tax Paid | Tax Assessment Tax Assessment Total Assessment is a certain percentage of the fair market value that is determined by local assessors to be the total taxable value of land and additions on the property. | Land | Improvement |
|---|---|---|---|---|
| 2025 | $4,091 | $66,280 | $18,109 | $48,171 |
| 2023 | $4,057 | $66,280 | $18,109 | $48,171 |
| 2022 | $3,374 | $49,403 | $13,454 | $35,949 |
| 2021 | $3,244 | $49,403 | $13,454 | $35,949 |
| 2020 | $3,339 | $49,403 | $13,454 | $35,949 |
| 2019 | $3,510 | $47,502 | $12,936 | $34,566 |
| 2018 | $3,515 | $47,502 | $12,936 | $34,566 |
| 2017 | $3,339 | $47,502 | $12,936 | $34,566 |
| 2016 | $3,496 | $49,067 | $13,843 | $35,224 |
| 2015 | $3,152 | $49,067 | $13,843 | $35,224 |
| 2014 | $3,175 | $49,067 | $13,843 | $35,224 |
| 2013 | $3,020 | $45,857 | $12,936 | $32,921 |
Source: Public Records
Map
Nearby Homes
- 1266 Avon Dr
- 1354 Avon Dr
- 1114 Egan Ct
- 3 Baker Cir
- 4518 Barbara Place
- 4635 Baker St
- 1525 Joseph St
- 943 Tennessee Ave
- 1409 Yarmouth Ave
- 1808 Maple Ave
- 4900 Chalet Dr
- 1218 Yarmouth Ave
- 1701 Sherman Ave
- 1819 Maple Ave
- 1827 Maple Ave
- 1318 Franklin Ave
- 1310 Franklin Ave
- 4905 Chalet Dr
- 4903 Chalet Dr
- 1226 Franklin Ave
- 4514 Perth Ln
- 4506 Perth Ln
- 1348 Westminster Dr
- 1352 Westminster Dr
- 4526 Perth Ln
- 1344 Westminster Dr
- 4519 Perth Ln
- 4523 Perth Ln
- 4515 Perth Ln
- 1318 Westminster Dr
- 1336 Westminster Dr
- 4500 Perth Ln
- 4505 Perth Ln
- 1354 Westminster Dr
- 1324 Westminster Dr
- 4527 Perth Ln
- 4501 Perth Ln
- 1302 Westminster Dr
- 4518 Bristol Ln
- 4524 Bristol Ln
Your Personal Tour Guide
Ask me questions while you tour the home.