


4518 S J St Tacoma, WA 98418
South End NeighborhoodEstimated payment $2,402/month
Highlights
- RV Access or Parking
- Property is near public transit
- Wood Flooring
- Craftsman Architecture
- Territorial View
- No HOA
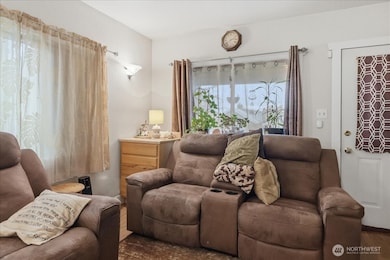
About This Home
Cozy Tacoma Starter Home with Potential! ?This charming 3-bed, 1-bath, 1,360 sq. ft. home is ready for its next chapter! Features a brand new gas furnace and alley access for convenience. The property has two sheds for storage and a fenced yard.While it needs TLC and your personal touch, this home offers fantastic potential to build instant equity in a great location. Perfect for investors or buyers looking to customize! Don't miss this opportunity in Tacoma.
Source: Northwest Multiple Listing Service (NWMLS)
MLS#: 2449572
Home Details
Home Type
- Single Family
Est. Annual Taxes
- $3,653
Year Built
- Built in 1923
Lot Details
- 5,590 Sq Ft Lot
- Property is Fully Fenced
- Level Lot
- Garden
Home Design
- Craftsman Architecture
- Block Foundation
- Composition Roof
- Metal Construction or Metal Frame
- Vinyl Construction Material
Interior Spaces
- 1,360 Sq Ft Home
- 1.5-Story Property
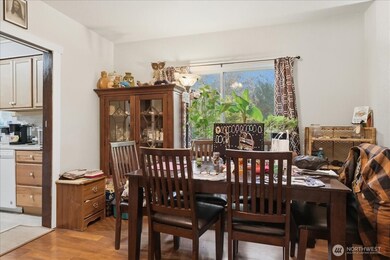
- Dining Room
- Territorial Views
- Storm Windows
- Unfinished Basement
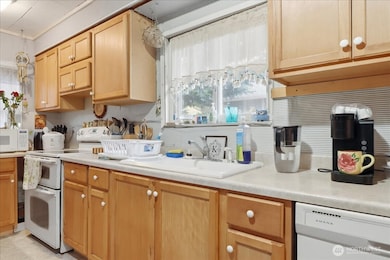
Kitchen
- Stove
- Dishwasher
Flooring
- Wood
- Carpet
- Vinyl
Bedrooms and Bathrooms
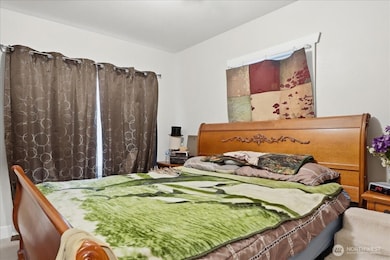
- 3 Main Level Bedrooms
- Bathroom on Main Level
- 1 Full Bathroom
Parking
- Driveway
- Off-Street Parking
- RV Access or Parking
Location
- Property is near public transit
- Property is near a bus stop
Utilities
- Forced Air Heating System
- Cable TV Available
Community Details
- No Home Owners Association
- South Tacoma Subdivision
Listing and Financial Details
- Down Payment Assistance Available
- Visit Down Payment Resource Website
- Tax Lot 9
- Assessor Parcel Number 8935027280
Map
Home Values in the Area
Average Home Value in this Area
Tax History
| Year | Tax Paid | Tax Assessment Tax Assessment Total Assessment is a certain percentage of the fair market value that is determined by local assessors to be the total taxable value of land and additions on the property. | Land | Improvement |
|---|---|---|---|---|
| 2025 | $3,500 | $337,000 | $203,400 | $133,600 |
| 2024 | $3,500 | $335,200 | $196,600 | $138,600 |
| 2023 | $3,500 | $314,100 | $184,600 | $129,500 |
| 2022 | $3,198 | $336,500 | $180,400 | $156,100 |
| 2021 | $2,905 | $230,800 | $104,000 | $126,800 |
| 2019 | $2,410 | $212,100 | $90,600 | $121,500 |
| 2018 | $2,532 | $185,100 | $78,900 | $106,200 |
| 2017 | $2,180 | $160,100 | $57,100 | $103,000 |
| 2016 | $1,924 | $117,200 | $41,700 | $75,500 |
| 2014 | $1,712 | $110,500 | $40,500 | $70,000 |
| 2013 | $1,712 | $102,300 | $37,100 | $65,200 |
Property History
| Date | Event | Price | List to Sale | Price per Sq Ft |
|---|---|---|---|---|
| 10/30/2025 10/30/25 | For Sale | $399,950 | -- | $294 / Sq Ft |
Purchase History
| Date | Type | Sale Price | Title Company |
|---|---|---|---|
| Warranty Deed | -- | None Available | |
| Warranty Deed | $110,000 | -- |
Mortgage History
| Date | Status | Loan Amount | Loan Type |
|---|---|---|---|
| Previous Owner | $113,300 | VA |
Source: Northwest Multiple Listing Service (NWMLS)
MLS Number: 2449572
APN: 893502-7280
Disclaimer: Certain information contained herein is derived from information provided by parties other than Homes.com. All information provided is deemed reliable, but is not guaranteed to be accurate and should be independently verified.
![]() All data is obtained from various sources and may not have been verified by broker or MLS GRID. Supplied Open House Information is subject to change without notice. All information should be independently reviewed and verified for accuracy. Properties may or may not be listed by the office/agent presenting the information. Listing information is provided by the Northwest Multiple Listing Service (NWMLS). Property information is based on available data that may include MLS information, county records, and other sources. Listings marked with the 3 tree icon and provided by NWMLS. All properties are subject to prior sale or withdrawal. IDX information is provided exclusively for consumers’ personal noncommercial use, that it may not be used for any purpose other than to identify prospective properties consumers may be interested in purchasing, that the data is deemed reliable but is not guaranteed by MLS GRID. ©2025 NWMLS.
All data is obtained from various sources and may not have been verified by broker or MLS GRID. Supplied Open House Information is subject to change without notice. All information should be independently reviewed and verified for accuracy. Properties may or may not be listed by the office/agent presenting the information. Listing information is provided by the Northwest Multiple Listing Service (NWMLS). Property information is based on available data that may include MLS information, county records, and other sources. Listings marked with the 3 tree icon and provided by NWMLS. All properties are subject to prior sale or withdrawal. IDX information is provided exclusively for consumers’ personal noncommercial use, that it may not be used for any purpose other than to identify prospective properties consumers may be interested in purchasing, that the data is deemed reliable but is not guaranteed by MLS GRID. ©2025 NWMLS.
Based on information submitted to the MLS GRID
- 4330 S K St
- 4319 S K St
- 4539 S L St
- 4605 S L St
- 4605 S Thompson Ave
- 1013 S 48th St
- 807 S 48th St
- 4512 S M St
- 4812 Yakima Ave
- 858 S 41st St
- 4822 S L St
- 4829 S Thompson Ave
- 711 S 43rd St
- 4537 S G St Unit A & B
- 4826 S M St
- 4834 S Park Ave
- 4107 S Sheridan Ave
- 1010 S 39th St
- 515 S 46th St
- 4309 Tacoma Ave S Unit 3
- 3809 S Thompson Ave
- 5001 Pacific Ave
- 4201 S Prospect St
- 2424 S 41st St
- 5412-5426 S Steele St
- 3202 Pacific Ave
- 2901 S 45th St
- 4720 S Pine St
- 4033 S Junett St
- 2825-2858 S Delin St
- 4802 S Pine St
- 4542 St
- 3005 S 47th St
- 4338 S Cedar St
- 3105 S 47th St
- 4315-4319 S Alder St
- 2503 S I St
- 3101 E D St
- 4023 S Lawrence St
- 2368 S Yakima Ave
