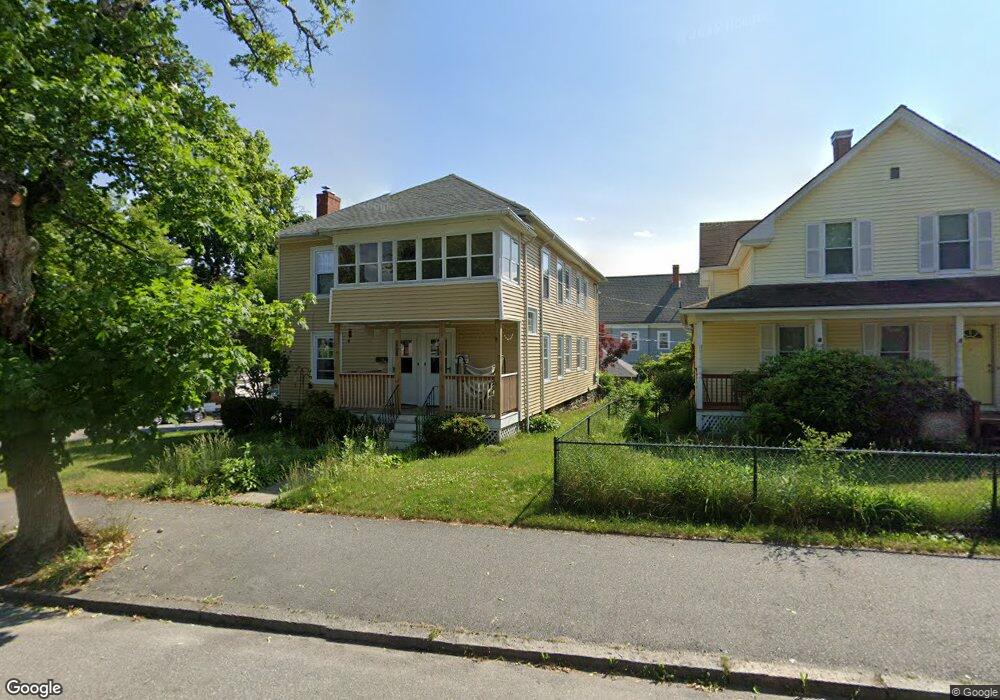
452 Chandler St Unit 1 Worcester, MA 01602
Newton Square NeighborhoodEstimated Value: $526,000 - $586,000
2
Beds
1
Bath
1,000
Sq Ft
$562/Sq Ft
Est. Value
About This Home
This home is located at 452 Chandler St Unit 1, Worcester, MA 01602 and is currently estimated at $562,499, approximately $562 per square foot. 452 Chandler St Unit 1 is a home located in Worcester County with nearby schools including Chandler Magnet, Jacob Hiatt Magnet School, and May Street Elementary School.
Ownership History
Date
Name
Owned For
Owner Type
Purchase Details
Closed on
Jul 16, 2014
Sold by
Fourkas Chris C Est
Bought by
Gace Petraq and Gace Ljudmilla
Current Estimated Value
Home Financials for this Owner
Home Financials are based on the most recent Mortgage that was taken out on this home.
Original Mortgage
$180,000
Outstanding Balance
$137,003
Interest Rate
4.14%
Mortgage Type
New Conventional
Estimated Equity
$425,496
Purchase Details
Closed on
Sep 25, 2008
Sold by
Johnson Richard B
Bought by
Fourkas Chris C
Home Financials for this Owner
Home Financials are based on the most recent Mortgage that was taken out on this home.
Original Mortgage
$212,000
Interest Rate
6.57%
Mortgage Type
Purchase Money Mortgage
Purchase Details
Closed on
May 1, 2000
Sold by
Fourkas Thekla and Fourkas Diane A
Bought by
Johnson Richard B
Purchase Details
Closed on
Dec 21, 1987
Sold by
Shea Mary E V
Bought by
Fourkas Diane A
Create a Home Valuation Report for This Property
The Home Valuation Report is an in-depth analysis detailing your home's value as well as a comparison with similar homes in the area
Home Values in the Area
Average Home Value in this Area
Purchase History
| Date | Buyer | Sale Price | Title Company |
|---|---|---|---|
| Gace Petraq | $240,000 | -- | |
| Fourkas Chris C | $265,000 | -- | |
| Johnson Richard B | $147,000 | -- | |
| Fourkas Diane A | $135,000 | -- |
Source: Public Records
Mortgage History
| Date | Status | Borrower | Loan Amount |
|---|---|---|---|
| Open | Gace Petraq | $180,000 | |
| Previous Owner | Fourkas Chris C | $212,000 | |
| Previous Owner | Fourkas Diane A | $10,000 | |
| Previous Owner | Fourkas Diane A | $124,960 | |
| Previous Owner | Fourkas Diane A | $25,000 |
Source: Public Records
Tax History Compared to Growth
Tax History
| Year | Tax Paid | Tax Assessment Tax Assessment Total Assessment is a certain percentage of the fair market value that is determined by local assessors to be the total taxable value of land and additions on the property. | Land | Improvement |
|---|---|---|---|---|
| 2025 | $6,516 | $494,000 | $108,000 | $386,000 |
| 2024 | $6,232 | $453,200 | $108,000 | $345,200 |
| 2023 | $5,832 | $406,700 | $93,900 | $312,800 |
| 2022 | $5,378 | $353,600 | $75,100 | $278,500 |
| 2021 | $4,905 | $301,300 | $60,100 | $241,200 |
| 2020 | $4,622 | $271,900 | $60,100 | $211,800 |
| 2019 | $4,642 | $257,900 | $54,000 | $203,900 |
| 2018 | $4,557 | $241,000 | $54,000 | $187,000 |
| 2017 | $4,357 | $226,700 | $54,000 | $172,700 |
| 2016 | $4,345 | $210,800 | $40,900 | $169,900 |
| 2015 | $4,231 | $210,800 | $40,900 | $169,900 |
| 2014 | $3,593 | $183,900 | $40,900 | $143,000 |
Source: Public Records
Map
Nearby Homes
- 452 Chandler St
- 454 Chandler St
- 456 Chandler St
- 1 Underwood St
- 450 Chandler St
- 450 Chandler St Unit 1
- 32 Hartshorn Ave
- 32 Hartshorn Ave Unit 2
- 458 Chandler St
- 3 Underwood St
- 2 Ruth St
- 449 Chandler St
- 451 Chandler St
- 451 Chandler St Unit 2
- 5 Underwood St
- 446 Chandler St
- 446 Chandler St Unit 2
- 447 Chandler St
- 455 Chandler St
- 28 Hartshorn Ave