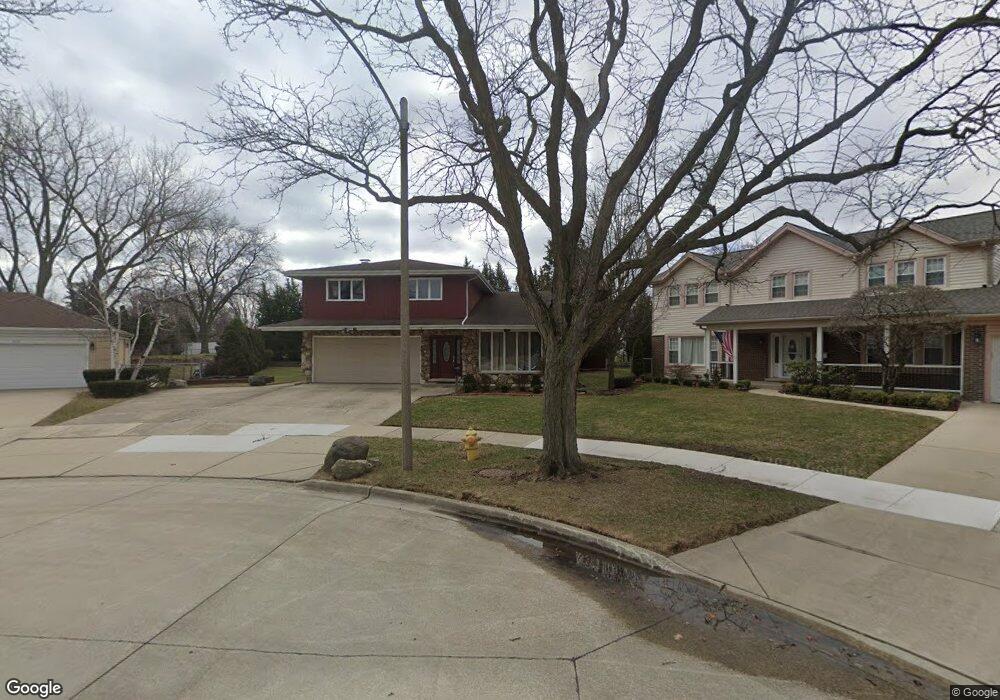
452 E Madison Ct Elmhurst, IL 60126
Estimated Value: $850,884 - $1,124,000
4
Beds
3
Baths
3,082
Sq Ft
$312/Sq Ft
Est. Value
About This Home
This home is located at 452 E Madison Ct, Elmhurst, IL 60126 and is currently estimated at $960,221, approximately $311 per square foot. 452 E Madison Ct is a home located in DuPage County with nearby schools including Pulaski Intl School of Chicago, Jefferson Elementary School, and Bryan Middle School.
Ownership History
Date
Name
Owned For
Owner Type
Purchase Details
Closed on
Jun 25, 2008
Sold by
Tumbarello Anthony F and Tumbarello Judith A
Bought by
Rosland Paul W and Rosland Patricia A
Current Estimated Value
Home Financials for this Owner
Home Financials are based on the most recent Mortgage that was taken out on this home.
Original Mortgage
$292,000
Outstanding Balance
$187,324
Interest Rate
5.96%
Mortgage Type
Stand Alone Refi Refinance Of Original Loan
Estimated Equity
$772,897
Purchase Details
Closed on
Jun 9, 2001
Sold by
Chipain George C and Chipain Joyce M
Bought by
Lamp Gary A and Lamp Laura L
Purchase Details
Closed on
Dec 23, 1996
Sold by
Mcelroy Michael E and Mcelroy Anne Marie
Bought by
Lamp Gary A and Lamp Laura L
Home Financials for this Owner
Home Financials are based on the most recent Mortgage that was taken out on this home.
Original Mortgage
$190,000
Interest Rate
7.6%
Mortgage Type
Purchase Money Mortgage
Create a Home Valuation Report for This Property
The Home Valuation Report is an in-depth analysis detailing your home's value as well as a comparison with similar homes in the area
Home Values in the Area
Average Home Value in this Area
Purchase History
| Date | Buyer | Sale Price | Title Company |
|---|---|---|---|
| Rosland Paul W | -- | Ctic | |
| Lamp Gary A | -- | -- | |
| Lamp Gary A | $320,500 | Attorneys Title Guaranty Fun |
Source: Public Records
Mortgage History
| Date | Status | Borrower | Loan Amount |
|---|---|---|---|
| Open | Rosland Paul W | $292,000 | |
| Previous Owner | Lamp Gary A | $190,000 |
Source: Public Records
Tax History Compared to Growth
Tax History
| Year | Tax Paid | Tax Assessment Tax Assessment Total Assessment is a certain percentage of the fair market value that is determined by local assessors to be the total taxable value of land and additions on the property. | Land | Improvement |
|---|---|---|---|---|
| 2024 | $14,940 | $255,903 | $109,135 | $146,768 |
| 2023 | $13,881 | $236,640 | $100,920 | $135,720 |
| 2022 | $13,430 | $227,480 | $97,010 | $130,470 |
| 2021 | $13,101 | $221,830 | $94,600 | $127,230 |
| 2020 | $12,597 | $216,970 | $92,530 | $124,440 |
| 2019 | $12,337 | $206,280 | $87,970 | $118,310 |
| 2018 | $11,789 | $196,290 | $83,280 | $113,010 |
| 2017 | $11,536 | $187,050 | $79,360 | $107,690 |
| 2016 | $11,299 | $176,210 | $74,760 | $101,450 |
| 2015 | $11,194 | $164,160 | $69,650 | $94,510 |
| 2014 | $11,247 | $151,950 | $55,280 | $96,670 |
| 2013 | $11,124 | $154,090 | $56,060 | $98,030 |
Source: Public Records
Map
Nearby Homes
- 705 S Edgewood Ave
- 494 E Atwood Ct
- 675 S Edgewood Ave
- 505 E Atwood Ct
- 522 E Park Manor Ct
- 341 E Madison St
- 593 S Edgewood Ave
- 353 E Butterfield Rd
- 550 S Hillcrest Ave
- 900 S Colfax Ave
- 274 E Crescent Ave
- 426 E Harrison St
- 613 S Chatham Ave
- 837 S Kearsage Ave
- 562 S Poplar Ave
- 2012 N Taft Ave
- 0S424 S Cadwell Ave
- 515 S Parkview Ave
- 185 E Oneida Ave
- 15W320 Concord St
- 467 E Adams St
- 448 E Madison Ct
- 456 E Madison Ct
- 469 E Adams St
- 465 E Adams St
- 444 E Madison Ct
- 460 E Madison Ct
- 775 S Cedar Ave
- 780 S Stratford Ave
- 771 S Cedar Ave
- 783 S Cedar Ave
- 784 S Stratford Ave
- 776 S Stratford Ave
- 471 E Adams St
- 785 S Cedar Ave
- 463 E Adams St
- 765 S Cedar Ave
- 770 S Stratford Ave
- 481 E Adams St
- 793 S Cedar Ave