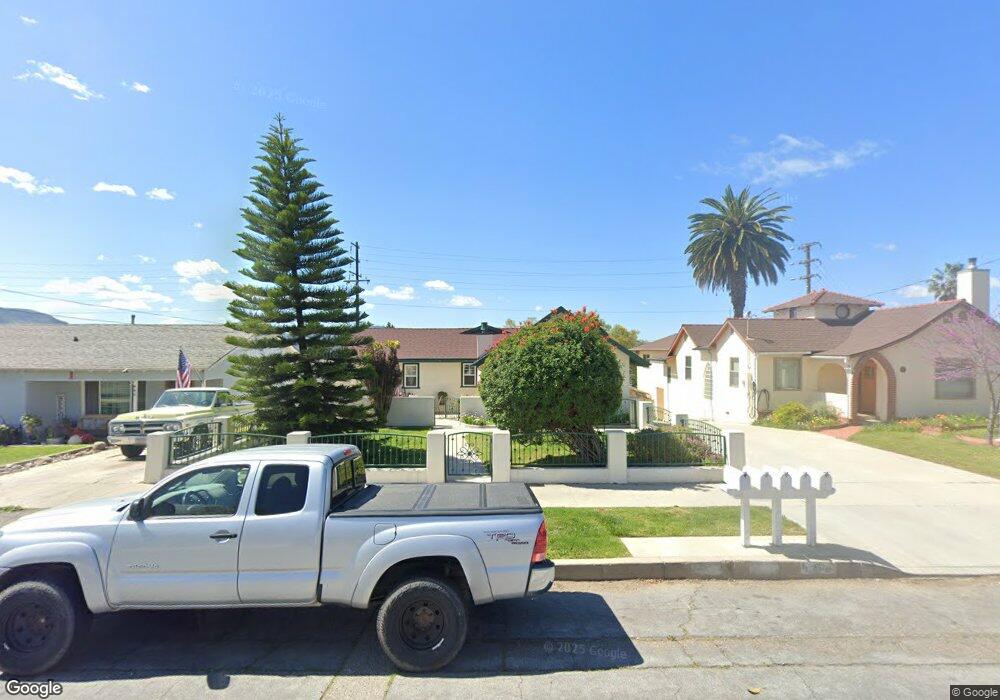
452 Foothill Dr Fillmore, CA 93015
Estimated Value: $711,000 - $914,000
3
Beds
3
Baths
1,831
Sq Ft
$430/Sq Ft
Est. Value
About This Home
This home is located at 452 Foothill Dr, Fillmore, CA 93015 and is currently estimated at $787,003, approximately $429 per square foot. 452 Foothill Dr is a home located in Ventura County with nearby schools including Fillmore Senior High.
Ownership History
Date
Name
Owned For
Owner Type
Purchase Details
Closed on
Feb 25, 2021
Sold by
Wyand Dena Marie
Bought by
Wyand Joel T and Wyand Dena Marie
Current Estimated Value
Home Financials for this Owner
Home Financials are based on the most recent Mortgage that was taken out on this home.
Original Mortgage
$376,000
Outstanding Balance
$279,802
Interest Rate
2.9%
Mortgage Type
New Conventional
Estimated Equity
$507,201
Purchase Details
Closed on
Dec 22, 2014
Sold by
Wyand Joel T
Bought by
Wyand Dena Marie
Purchase Details
Closed on
Oct 26, 1998
Sold by
Howard Kenneth Ruth Trust A and Charlene R
Bought by
Wyand Joel T and Wyand Dena Marie
Home Financials for this Owner
Home Financials are based on the most recent Mortgage that was taken out on this home.
Original Mortgage
$137,700
Interest Rate
6.91%
Mortgage Type
VA
Create a Home Valuation Report for This Property
The Home Valuation Report is an in-depth analysis detailing your home's value as well as a comparison with similar homes in the area
Home Values in the Area
Average Home Value in this Area
Purchase History
| Date | Buyer | Sale Price | Title Company |
|---|---|---|---|
| Wyand Joel T | -- | Fidelity National Title | |
| Wyand Dena Marie | -- | None Available | |
| Wyand Joel T | $139,500 | Old Republic Title Company |
Source: Public Records
Mortgage History
| Date | Status | Borrower | Loan Amount |
|---|---|---|---|
| Open | Wyand Joel T | $376,000 | |
| Previous Owner | Wyand Joel T | $137,700 |
Source: Public Records
Tax History Compared to Growth
Tax History
| Year | Tax Paid | Tax Assessment Tax Assessment Total Assessment is a certain percentage of the fair market value that is determined by local assessors to be the total taxable value of land and additions on the property. | Land | Improvement |
|---|---|---|---|---|
| 2025 | $3,589 | $329,120 | $109,727 | $219,393 |
| 2024 | $3,589 | $322,667 | $107,575 | $215,092 |
| 2023 | $3,540 | $316,341 | $105,466 | $210,875 |
| 2022 | $3,271 | $310,139 | $103,398 | $206,741 |
| 2021 | $3,718 | $304,058 | $101,370 | $202,688 |
| 2020 | $3,448 | $300,942 | $100,332 | $200,610 |
| 2019 | $3,457 | $295,042 | $98,365 | $196,677 |
| 2018 | $3,387 | $289,258 | $96,437 | $192,821 |
| 2017 | $3,405 | $283,588 | $94,547 | $189,041 |
| 2016 | $3,152 | $278,029 | $92,694 | $185,335 |
| 2015 | $3,063 | $273,854 | $91,302 | $182,552 |
| 2014 | $3,060 | $268,491 | $89,514 | $178,977 |
Source: Public Records
Map
Nearby Homes
- 412 Blaine Ave
- 638 Clay St
- 770 Edison Ln
- 0 Fillmore St
- 340 Central Ave
- 1407 Goodenough Rd
- 621 Lemon Way
- 229 Main St
- 803 Sespe Ave
- 939 Meadowlark Dr
- 1028 Meadowlark Dr
- 1041 Meadowlark Dr
- 1032 Meadowlark Dr
- 1526 Grand Ave
- 1062 Meadowlark Dr
- 600 C St
- 196 Elmwood St
- 199 Rosewood St
- 185 Rosewood St
- 89 Willow St
- 456 Foothill Dr
- 446 Foothill Dr
- 462 Foothill Dr
- 442 Foothill Dr
- 890 Central Ave
- 466 Foothill Dr
- 436 Foothill Dr
- 846 Valley Vista
- 0 Foothill Dr
- 472 Foothill Dr
- 432 Foothill Dr
- 842 Valley Vista
- 451 Foothill Dr
- 902 Central Ave
- 445 Foothill Dr
- 441 Foothill Dr
- 455 Foothill Dr
- 843 Valley Vista
- 461 Foothill Dr
- 476 Foothill Dr