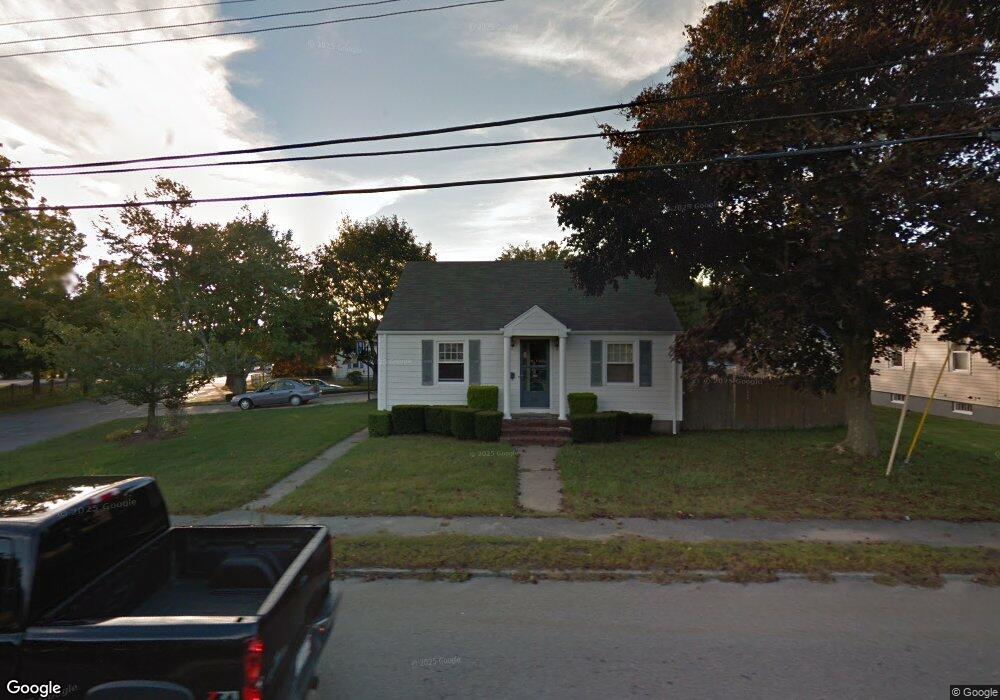
452 Main St Fairhaven, MA 02719
North Fairhaven NeighborhoodEstimated Value: $404,000 - $511,000
3
Beds
1
Bath
868
Sq Ft
$507/Sq Ft
Est. Value
About This Home
This home is located at 452 Main St, Fairhaven, MA 02719 and is currently estimated at $439,916, approximately $506 per square foot. 452 Main St is a home located in Bristol County with nearby schools including Fairhaven High School, Alma Del Mar Charter School, and St. Joseph School.
Ownership History
Date
Name
Owned For
Owner Type
Purchase Details
Closed on
Nov 21, 2024
Sold by
Moura Colleen and Moura Eric C
Bought by
Moura Eric C and Moura Colleen
Current Estimated Value
Purchase Details
Closed on
Apr 27, 2000
Sold by
Foley Grace
Bought by
Moura Eric C and Moura Colleen
Create a Home Valuation Report for This Property
The Home Valuation Report is an in-depth analysis detailing your home's value as well as a comparison with similar homes in the area
Home Values in the Area
Average Home Value in this Area
Purchase History
| Date | Buyer | Sale Price | Title Company |
|---|---|---|---|
| Moura Eric C | -- | None Available | |
| Moura Eric C | -- | None Available | |
| Moura Eric C | $127,001 | -- | |
| Moura Eric C | $127,001 | -- |
Source: Public Records
Mortgage History
| Date | Status | Borrower | Loan Amount |
|---|---|---|---|
| Previous Owner | Moura Eric C | $144,500 | |
| Previous Owner | Moura Eric C | $144,500 | |
| Previous Owner | Moura Eric C | $7,500 |
Source: Public Records
Tax History
| Year | Tax Paid | Tax Assessment Tax Assessment Total Assessment is a certain percentage of the fair market value that is determined by local assessors to be the total taxable value of land and additions on the property. | Land | Improvement |
|---|---|---|---|---|
| 2025 | $35 | $371,400 | $174,700 | $196,700 |
| 2024 | $3,314 | $359,100 | $174,700 | $184,400 |
| 2023 | $3,071 | $308,600 | $153,000 | $155,600 |
| 2022 | $2,973 | $290,900 | $142,200 | $148,700 |
| 2021 | $2,892 | $256,200 | $128,700 | $127,500 |
| 2020 | $2,834 | $256,200 | $128,700 | $127,500 |
| 2019 | $2,672 | $229,000 | $106,700 | $122,300 |
| 2018 | $0 | $218,500 | $101,600 | $116,900 |
| 2017 | $2,533 | $210,400 | $101,600 | $108,800 |
| 2016 | $2,531 | $207,800 | $101,600 | $106,200 |
| 2015 | $2,425 | $199,600 | $101,600 | $98,000 |
Source: Public Records
Map
Nearby Homes
Your Personal Tour Guide
Ask me questions while you tour the home.