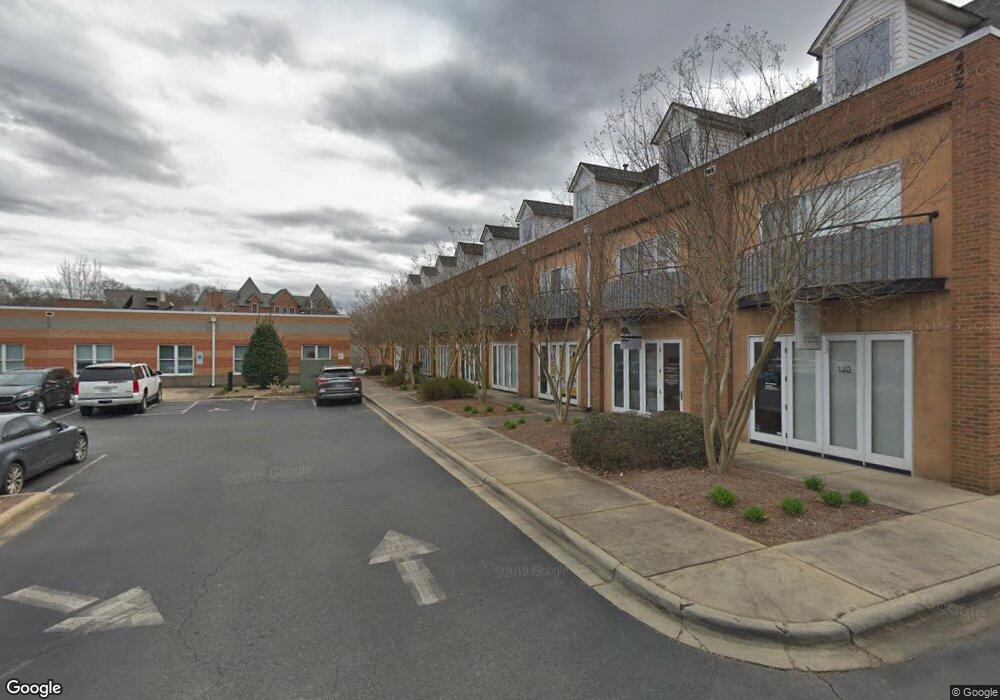
452 S Main St Unit J Davidson, NC 28036
Estimated Value: $485,704
--
Bed
--
Bath
1,524
Sq Ft
$319/Sq Ft
Est. Value
About This Home
This home is located at 452 S Main St Unit J, Davidson, NC 28036 and is currently estimated at $485,704, approximately $318 per square foot. 452 S Main St Unit J is a home located in Mecklenburg County with nearby schools including Davidson Elementary School, William Amos Hough High School, and Davidson Green School.
Ownership History
Date
Name
Owned For
Owner Type
Purchase Details
Closed on
Sep 3, 2015
Sold by
Henderson Phillip M and Henderson Shelly L
Bought by
Northwest Charlotte Properties Llc
Current Estimated Value
Home Financials for this Owner
Home Financials are based on the most recent Mortgage that was taken out on this home.
Original Mortgage
$110,000
Outstanding Balance
$86,486
Interest Rate
3.94%
Mortgage Type
Commercial
Estimated Equity
$399,218
Purchase Details
Closed on
Jul 16, 2010
Sold by
T G T N Llc
Bought by
Henderson Philip M
Home Financials for this Owner
Home Financials are based on the most recent Mortgage that was taken out on this home.
Original Mortgage
$142,800
Interest Rate
4.79%
Mortgage Type
Commercial
Purchase Details
Closed on
May 6, 2008
Sold by
Neal Jerry W and Neal Charlotte F
Bought by
T G T N Llc
Create a Home Valuation Report for This Property
The Home Valuation Report is an in-depth analysis detailing your home's value as well as a comparison with similar homes in the area
Home Values in the Area
Average Home Value in this Area
Purchase History
| Date | Buyer | Sale Price | Title Company |
|---|---|---|---|
| Northwest Charlotte Properties Llc | -- | Attorney | |
| Henderson Philip M | $168,000 | None Available | |
| T G T N Llc | -- | None Available |
Source: Public Records
Mortgage History
| Date | Status | Borrower | Loan Amount |
|---|---|---|---|
| Open | Northwest Charlotte Properties Llc | $110,000 | |
| Previous Owner | Henderson Philip M | $142,800 |
Source: Public Records
Tax History Compared to Growth
Tax History
| Year | Tax Paid | Tax Assessment Tax Assessment Total Assessment is a certain percentage of the fair market value that is determined by local assessors to be the total taxable value of land and additions on the property. | Land | Improvement |
|---|---|---|---|---|
| 2025 | -- | $282,100 | -- | $282,100 |
| 2024 | -- | $282,100 | -- | $282,100 |
| 2023 | $2,785 | $282,100 | $0 | $282,100 |
| 2022 | $2,785 | $295,700 | $0 | $295,700 |
| 2021 | $2,682 | $295,700 | $0 | $295,700 |
| 2020 | $2,682 | $295,700 | $0 | $295,700 |
| 2019 | $2,682 | $295,700 | $0 | $295,700 |
| 2018 | $2,007 | $171,100 | $50,000 | $121,100 |
| 2017 | $1,995 | $171,100 | $50,000 | $121,100 |
| 2016 | $1,995 | $171,100 | $50,000 | $121,100 |
| 2015 | $1,995 | $171,100 | $50,000 | $121,100 |
| 2014 | $1,995 | $171,100 | $50,000 | $121,100 |
Source: Public Records
Map
Nearby Homes
- 522 Potts St
- 504 Potts St
- 329 Goodrum St
- 343 Spring St
- 325 Goodrum St
- 315 S Main St
- 324 Walnut St
- 222 Walnut St
- 624 James Alexander Way
- 216 Walnut St
- 317 Catawba Ave
- 729 Hoke Ln
- 119 Meadowbrook Ln
- 137 Meadowbrook Ln
- 553 Annie Lowery Way
- 541 Annie Lowery Way
- 537 Annie Lowery Way
- 407 Jetton St
- 707 Hoke Ln
- 335 Catawba Ave
- 452 S Main St Unit E
- 452 S Main St Unit G
- 452 S Main St Unit A
- 452 S Main St
- 452 S Main St
- 452 S Main St
- 452 S Main St
- 452 S Main St Unit D
- 452 S Main St Unit C
- 452 S Main St Unit B
- 452 S Main St
- 452 S Main St Unit I
- 452 S Main St Unit 105
- 442 S Main St Unit Office 20
- 442 S Main St Unit Office 13
- 442 S Main St Unit Office 09
- 442 S Main St Unit Office 02
- 442 S Main St Unit Office 21
- 442 S Main St Unit Office 19
- 442 S Main St Unit 12