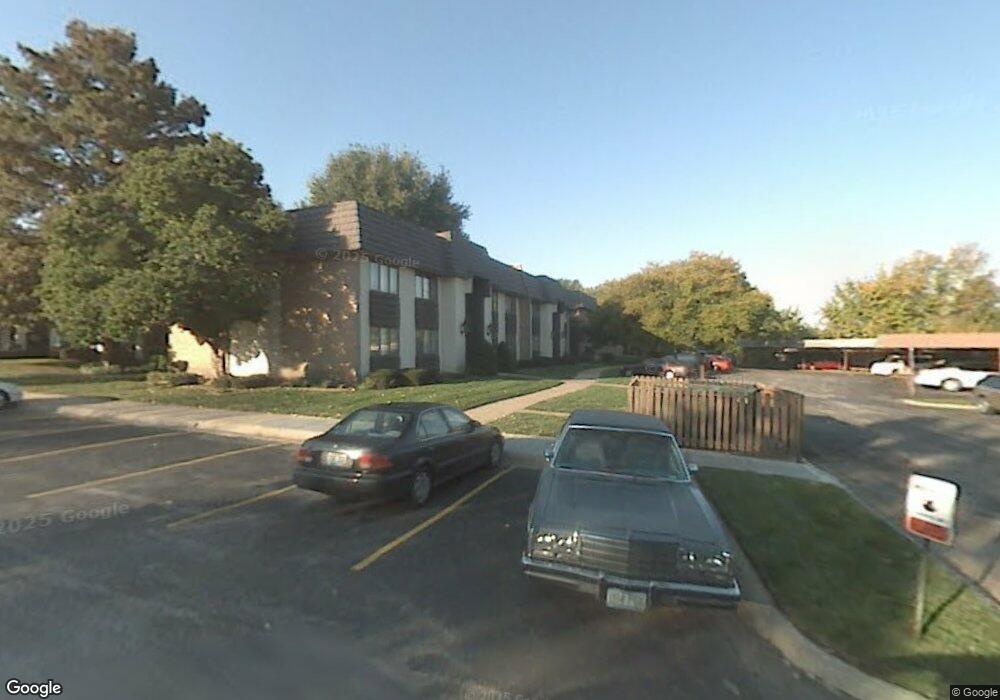
452 W 104th Unit C St Kansas City, MO 64114
Country Lane Estates NeighborhoodEstimated Value: $105,000 - $110,000
1
Bed
1
Bath
827
Sq Ft
$129/Sq Ft
Est. Value
About This Home
This home is located at 452 W 104th Unit C St, Kansas City, MO 64114 and is currently estimated at $106,792, approximately $129 per square foot. 452 W 104th Unit C St is a home located in Jackson County with nearby schools including Red Bridge Elementary School, Center Middle School, and Center High School.
Ownership History
Date
Name
Owned For
Owner Type
Purchase Details
Closed on
Mar 23, 2022
Sold by
Kristy Whiting
Bought by
Dealmeida Clovis and De Almeida Cecilia
Current Estimated Value
Home Financials for this Owner
Home Financials are based on the most recent Mortgage that was taken out on this home.
Original Mortgage
$74,400
Outstanding Balance
$69,699
Interest Rate
4.16%
Mortgage Type
New Conventional
Estimated Equity
$37,093
Purchase Details
Closed on
May 21, 2019
Sold by
Wilson Bethany E
Bought by
Whiting Kristy
Purchase Details
Closed on
Mar 6, 2007
Sold by
Field Noel Vincent and Field Lauren Elizabeth
Bought by
Wilson Bethany E
Purchase Details
Closed on
Oct 4, 2006
Sold by
Field Lauren
Bought by
Field Noel
Purchase Details
Closed on
Dec 27, 2001
Sold by
Cartwright Thomas W and Cartwright Judith A
Bought by
Field Noel Vincent and Field Lauren Elizabeth
Home Financials for this Owner
Home Financials are based on the most recent Mortgage that was taken out on this home.
Original Mortgage
$48,500
Interest Rate
6.41%
Purchase Details
Closed on
Jun 8, 1998
Sold by
Fox Marie E
Bought by
Cartwright Thomas W
Create a Home Valuation Report for This Property
The Home Valuation Report is an in-depth analysis detailing your home's value as well as a comparison with similar homes in the area
Home Values in the Area
Average Home Value in this Area
Purchase History
| Date | Buyer | Sale Price | Title Company |
|---|---|---|---|
| Dealmeida Clovis | -- | American Title | |
| Dealmeida Clovis | -- | American Title | |
| Whiting Kristy | -- | None Available | |
| Wilson Bethany E | -- | First American Title Co | |
| Field Noel | -- | None Available | |
| Field Noel Vincent | -- | -- | |
| Cartwright Thomas W | -- | -- |
Source: Public Records
Mortgage History
| Date | Status | Borrower | Loan Amount |
|---|---|---|---|
| Open | Dealmeida Clovis | $74,400 | |
| Closed | Dealmeida Clovis | $74,400 | |
| Previous Owner | Field Noel Vincent | $48,500 |
Source: Public Records
Tax History Compared to Growth
Tax History
| Year | Tax Paid | Tax Assessment Tax Assessment Total Assessment is a certain percentage of the fair market value that is determined by local assessors to be the total taxable value of land and additions on the property. | Land | Improvement |
|---|---|---|---|---|
| 2025 | $1,341 | $14,071 | $342 | $13,729 |
| 2024 | $1,314 | $17,366 | $847 | $16,519 |
| 2023 | $1,314 | $17,366 | $1,478 | $15,888 |
| 2022 | $927 | $10,640 | $2,588 | $8,052 |
| 2021 | $925 | $10,640 | $2,588 | $8,052 |
| 2020 | $870 | $9,354 | $2,588 | $6,766 |
| 2019 | $786 | $9,354 | $2,588 | $6,766 |
| 2018 | $969,505 | $7,059 | $2,588 | $4,471 |
| 2017 | $671 | $7,059 | $2,588 | $4,471 |
| 2016 | $671 | $6,954 | $2,588 | $4,366 |
| 2014 | $679 | $6,954 | $2,588 | $4,366 |
Source: Public Records
Map
Nearby Homes
- 462 W 104th #B St Unit B
- 464 W 104th St Unit A
- 447 W 104th St
- 449 W 104th St Unit E
- 435 W 104th St Unit E
- 10604 Jefferson St
- 10612 Jefferson St
- 10605 Jefferson St
- 10613 Jefferson St
- 10617 Jefferson St
- 10621 Jefferson St
- 10625 Jefferson St
- 10629 Jefferson St
- 10414 Baltimore Ave
- 511 W 101st St
- 10801 Washington Ct
- 602 W 101st St
- 405 W 101st St
- 126 E Bridlespur Dr
- 4 W Bridlespur Terrace
- 454 W 104 #B St
- 474 W 104th St
- 474 W 104th St Unit C
- 474 W 104th St Unit D
- 474 W 104th St Unit A
- 474 W 104th St Unit E
- 458 W 104th #D St
- 460 W 104th #D St Unit 206Y
- 462 W 104th #B St
- 462 W 104 #D St
- 472 W 104 #A St Unit A
- 464 W 104th # D St Unit D
- 464 W 104th #D St
- 470 W 104 St Unit B
- 470 W 104th St
- 470 W 104th St Unit D
- 470 W 104th St Unit E
- 470 W 104th St Unit A
- 470 W 104th St Unit B
- 470 W 104th #E St