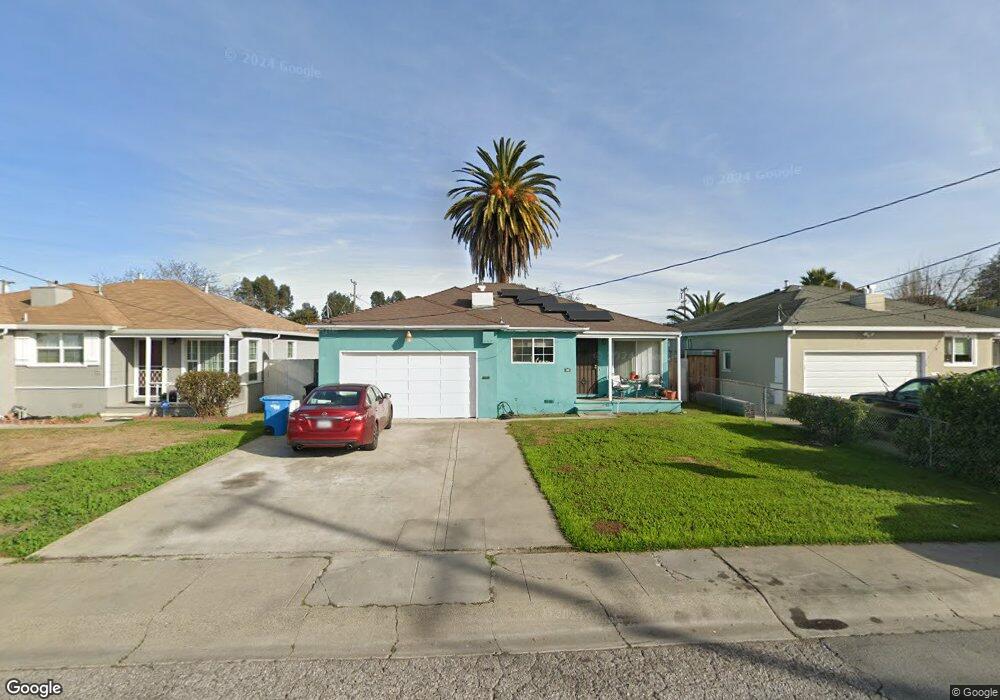
452 Wisteria Dr East Palo Alto, CA 94303
Estimated Value: $886,000 - $1,190,000
3
Beds
1
Bath
1,110
Sq Ft
$931/Sq Ft
Est. Value
About This Home
This home is located at 452 Wisteria Dr, East Palo Alto, CA 94303 and is currently estimated at $1,033,253, approximately $930 per square foot. 452 Wisteria Dr is a home located in San Mateo County with nearby schools including Brentwood Academy, Menlo-Atherton High School, and Aspire East Palo Alto Charter School.
Ownership History
Date
Name
Owned For
Owner Type
Purchase Details
Closed on
May 2, 2006
Sold by
Lowery Casaundra R
Bought by
Lowery Charles P
Current Estimated Value
Home Financials for this Owner
Home Financials are based on the most recent Mortgage that was taken out on this home.
Original Mortgage
$355,000
Outstanding Balance
$204,305
Interest Rate
6.29%
Mortgage Type
New Conventional
Estimated Equity
$828,948
Purchase Details
Closed on
Jul 7, 2005
Sold by
Vinson Janet Marie
Bought by
Lowery Charles P
Home Financials for this Owner
Home Financials are based on the most recent Mortgage that was taken out on this home.
Original Mortgage
$300,000
Interest Rate
5.55%
Mortgage Type
Stand Alone First
Purchase Details
Closed on
May 31, 2005
Sold by
Lowery Curtis
Bought by
Lowery Charles P
Home Financials for this Owner
Home Financials are based on the most recent Mortgage that was taken out on this home.
Original Mortgage
$300,000
Interest Rate
5.55%
Mortgage Type
Stand Alone First
Create a Home Valuation Report for This Property
The Home Valuation Report is an in-depth analysis detailing your home's value as well as a comparison with similar homes in the area
Home Values in the Area
Average Home Value in this Area
Purchase History
| Date | Buyer | Sale Price | Title Company |
|---|---|---|---|
| Lowery Charles P | -- | Financial Title Company | |
| Lowery Charles P | -- | Alliance Title | |
| Lowery Charles P | -- | Alliance Title |
Source: Public Records
Mortgage History
| Date | Status | Borrower | Loan Amount |
|---|---|---|---|
| Open | Lowery Charles P | $355,000 | |
| Closed | Lowery Charles P | $300,000 |
Source: Public Records
Tax History Compared to Growth
Tax History
| Year | Tax Paid | Tax Assessment Tax Assessment Total Assessment is a certain percentage of the fair market value that is determined by local assessors to be the total taxable value of land and additions on the property. | Land | Improvement |
|---|---|---|---|---|
| 2025 | $6,380 | $433,004 | $347,112 | $85,892 |
| 2023 | $6,380 | $416,194 | $333,635 | $82,559 |
| 2022 | $5,897 | $408,035 | $327,094 | $80,941 |
| 2021 | $5,772 | $400,036 | $320,681 | $79,355 |
| 2020 | $5,676 | $395,936 | $317,394 | $78,542 |
| 2019 | $5,687 | $388,174 | $311,171 | $77,003 |
| 2018 | $5,566 | $380,565 | $305,070 | $75,495 |
| 2017 | $5,374 | $373,105 | $299,089 | $74,016 |
| 2016 | $5,357 | $365,791 | $293,226 | $72,565 |
| 2015 | $5,287 | $360,298 | $288,822 | $71,476 |
| 2014 | $5,180 | $353,242 | $283,165 | $70,077 |
Source: Public Records
Map
Nearby Homes
- 1168 Beech St
- 279 Verbena Dr
- 2260 Pulgas Ave
- 120 Gardenia Way
- 1038 Runnymede St
- 164 Wisteria Dr
- 159 Jasmine Way
- 120 Abelia Way
- 1788 E Bayshore Rd
- 1893 Woodland Ave
- 1831 Woodland Ave
- 1827 Woodland Ave
- 1879 Woodland Ave
- 1597 Edgewood Dr
- 525 Aspen Place
- 801 Weeks St
- 640 Circle Dr
- 2340 Cooley Ave
- 2232 Euclid Ave
- 653 Wildwood Ln
- 456 Wisteria Dr
- 448 Wisteria Dr
- 444 Wisteria Dr
- 460 Wisteria Dr
- 451 Larkspur Dr
- 455 Larkspur Dr
- 447 Larkspur Dr
- 459 Larkspur Dr
- 440 Wisteria Dr
- 451 Wisteria Dr
- 464 Wisteria Dr
- 455 Wisteria Dr
- 443 Larkspur Dr
- 447 Wisteria Dr
- 463 Larkspur Dr
- 459 Wisteria Dr
- 443 Wisteria Dr
- 436 Wisteria Dr
- 463 Wisteria Dr
- 439 Larkspur Dr