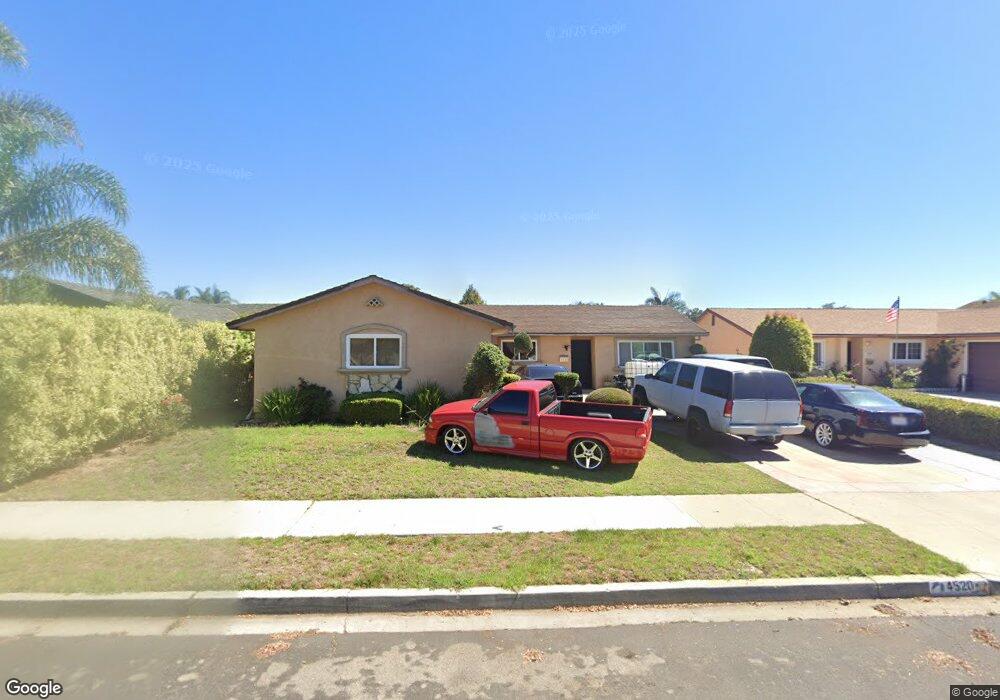
4520 Anchorage St Oxnard, CA 93033
Terrace Estates NeighborhoodEstimated Value: $669,543 - $715,000
4
Beds
2
Baths
1,288
Sq Ft
$536/Sq Ft
Est. Value
About This Home
This home is located at 4520 Anchorage St, Oxnard, CA 93033 and is currently estimated at $690,386, approximately $536 per square foot. 4520 Anchorage St is a home located in Ventura County with nearby schools including Fred L. Williams Elementary School and Channel Islands High School.
Ownership History
Date
Name
Owned For
Owner Type
Purchase Details
Closed on
Oct 6, 2017
Sold by
Chavira Jorge Duran and Chavira Elena M
Bought by
Chavira Elena M and Chavira Jorge
Current Estimated Value
Purchase Details
Closed on
May 30, 2002
Sold by
Medina Leopoldo
Bought by
Chavira Jorge Duran and Chavira Elena M
Home Financials for this Owner
Home Financials are based on the most recent Mortgage that was taken out on this home.
Original Mortgage
$201,500
Outstanding Balance
$84,777
Interest Rate
6.74%
Estimated Equity
$605,609
Purchase Details
Closed on
Mar 10, 2000
Sold by
Bao Cao
Bought by
Chavira Jorge Duran and Chavira Elena M
Home Financials for this Owner
Home Financials are based on the most recent Mortgage that was taken out on this home.
Original Mortgage
$199,356
Interest Rate
8.24%
Mortgage Type
FHA
Create a Home Valuation Report for This Property
The Home Valuation Report is an in-depth analysis detailing your home's value as well as a comparison with similar homes in the area
Home Values in the Area
Average Home Value in this Area
Purchase History
| Date | Buyer | Sale Price | Title Company |
|---|---|---|---|
| Chavira Elena M | -- | Title 365 | |
| Chavira Jorge Duran | $67,500 | Old Republic Title Ins Compa | |
| Chavira Jorge Duran | $204,000 | American Title Co |
Source: Public Records
Mortgage History
| Date | Status | Borrower | Loan Amount |
|---|---|---|---|
| Open | Chavira Jorge Duran | $201,500 | |
| Previous Owner | Chavira Jorge Duran | $199,356 |
Source: Public Records
Tax History
| Year | Tax Paid | Tax Assessment Tax Assessment Total Assessment is a certain percentage of the fair market value that is determined by local assessors to be the total taxable value of land and additions on the property. | Land | Improvement |
|---|---|---|---|---|
| 2025 | $3,975 | $338,504 | $135,399 | $203,105 |
| 2024 | $3,975 | $331,867 | $132,744 | $199,123 |
| 2023 | $3,740 | $325,360 | $130,141 | $195,219 |
| 2022 | $3,662 | $318,981 | $127,589 | $191,392 |
| 2021 | $3,706 | $312,727 | $125,087 | $187,640 |
| 2020 | $3,773 | $309,522 | $123,805 | $185,717 |
| 2019 | $3,658 | $303,454 | $121,378 | $182,076 |
| 2018 | $3,522 | $297,505 | $118,999 | $178,506 |
| 2017 | $3,407 | $291,672 | $116,666 | $175,006 |
| 2016 | $3,244 | $285,954 | $114,379 | $171,575 |
| 2015 | $3,292 | $281,661 | $112,662 | $168,999 |
| 2014 | $3,231 | $276,146 | $110,456 | $165,690 |
Source: Public Records
Map
Nearby Homes
- 4340 Highland Ave
- 5117 Jefferson Square
- 5222 Longfellow Way
- 860 Morro Way
- 4221 Justin Way
- 4160 Petit Dr Unit 39
- 280 Columbia Place Unit 48
- 360 Ibsen Place Unit 129
- 2117 Cardinal Ave Unit 2117h
- 5204 Columbus Place
- 2167 Robin Ave
- 140 Gaviota Place Unit 157
- 5225 Columbus Place
- 2177 Robin Ave Unit 2177A
- 4200 S A St
- 3631 La Costa Place
- 3700 Olds Rd Unit 38
- 3700 Olds Rd Unit 86
- 2178 Thrush Ave Unit J
- 3130 Paula St
- 4510 Anchorage St
- 4530 Anchorage St
- 4521 Boston Way
- 4531 Boston Way
- 4511 Boston Way
- 4500 Anchorage St
- 4540 Anchorage St
- 4601 Boston Way
- 4501 Boston Way
- 4525 Anchorage St
- 4515 Anchorage St
- 4535 Anchorage St
- 4424 Anchorage St
- 4604 Anchorage St
- 4505 Anchorage St
- 4611 Boston Way
- 4441 Boston Way
- 4601 Anchorage St
- 4416 Anchorage St
- 4614 Anchorage St
Your Personal Tour Guide
Ask me questions while you tour the home.