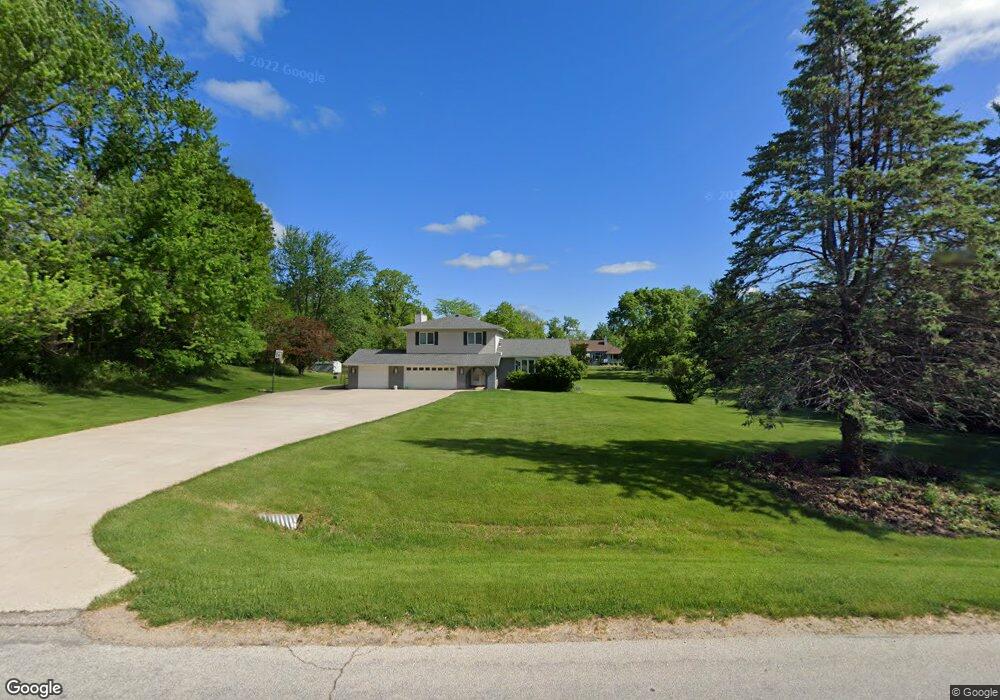
4520 Deer View Rd Cedar Rapids, IA 52411
Estimated Value: $390,345 - $435,000
3
Beds
3
Baths
2,070
Sq Ft
$203/Sq Ft
Est. Value
About This Home
This home is located at 4520 Deer View Rd, Cedar Rapids, IA 52411 and is currently estimated at $419,836, approximately $202 per square foot. 4520 Deer View Rd is a home located in Linn County with nearby schools including Viola Gibson Elementary School, Harding Middle School, and John F. Kennedy High School.
Ownership History
Date
Name
Owned For
Owner Type
Purchase Details
Closed on
Jul 21, 2016
Sold by
Lyons Traci A
Bought by
Lyons Christopher S
Current Estimated Value
Home Financials for this Owner
Home Financials are based on the most recent Mortgage that was taken out on this home.
Original Mortgage
$138,500
Outstanding Balance
$13,513
Interest Rate
3.56%
Mortgage Type
New Conventional
Estimated Equity
$406,323
Purchase Details
Closed on
Mar 16, 2002
Sold by
Sayre R Keith and Sayre Karen L
Bought by
Lyons Christopher S and Lyons Traci A
Home Financials for this Owner
Home Financials are based on the most recent Mortgage that was taken out on this home.
Original Mortgage
$147,900
Interest Rate
6.25%
Purchase Details
Closed on
Jan 16, 2001
Sold by
Streif John J and Streif Bonnie L
Bought by
Sayre R Keith and Sayre Karen L
Create a Home Valuation Report for This Property
The Home Valuation Report is an in-depth analysis detailing your home's value as well as a comparison with similar homes in the area
Purchase History
| Date | Buyer | Sale Price | Title Company |
|---|---|---|---|
| Lyons Christopher S | -- | None Available | |
| Lyons Christopher S | $184,500 | -- | |
| Sayre R Keith | $182,500 | -- |
Source: Public Records
Mortgage History
| Date | Status | Borrower | Loan Amount |
|---|---|---|---|
| Open | Lyons Christopher S | $138,500 | |
| Previous Owner | Lyons Christopher S | $147,900 |
Source: Public Records
Tax History
| Year | Tax Paid | Tax Assessment Tax Assessment Total Assessment is a certain percentage of the fair market value that is determined by local assessors to be the total taxable value of land and additions on the property. | Land | Improvement |
|---|---|---|---|---|
| 2025 | $3,648 | $359,000 | $68,900 | $290,100 |
| 2024 | $3,916 | $324,600 | $68,900 | $255,700 |
| 2023 | $3,916 | $324,600 | $68,900 | $255,700 |
| 2022 | $3,868 | $285,900 | $68,900 | $217,000 |
| 2021 | $3,990 | $285,900 | $68,900 | $217,000 |
| 2020 | $3,990 | $272,800 | $51,600 | $221,200 |
| 2019 | $3,608 | $252,500 | $51,600 | $200,900 |
Source: Public Records
Map
Nearby Homes
- 4675 Leprechaun Ln
- 4615 Blarney Dr
- 4362 Cloverdale Rd
- 6060 Wayside Cir
- 6001 Ridgewood Meadows Ln NE
- 4638 Blossom View Ct NE
- 5012 Autumn Dr
- 4911 Windy Meadow Cir NE
- 6718 Lauder Ln
- 6720 Caldwell Ln
- 5924 Gibson Dr NE
- 4021 Maple Ridge Ct NE
- 5843 Wells Ln
- 220 S Blairsferry Crossing
- 4620 N River Blvd NE
- 4620 Prairie Stone Dr NE
- 4408 Prairie Stone Dr NE
- 4510 Prairie Stone Dr NE
- 50 Ridgewood Dr
- 4612 Chestnut Ridge Ct NE
- 4200 Antler Dr
- 4510 Deer View Rd
- 4500 Deer View Rd
- 5506 Antler Dr
- 5500 Antler Dr
- 4521 Deer View Rd
- 4201 Antler Dr
- 4531 Deer View Rd
- 5501 Hickorywood Ct
- 4460 Deer View Rd
- 4511 Deer View Rd
- 4501 Deer View Rd
- 5501 Antler Dr
- 5511 Hickorywood Ct
- 4550 Deer View Rd
- 5510 Antler Dr
- 4551 Deer View Rd
- 4450 Deer View Rd
- 4603 Blarney Dr
- 5510 Hickorywood Ct
Your Personal Tour Guide
Ask me questions while you tour the home.