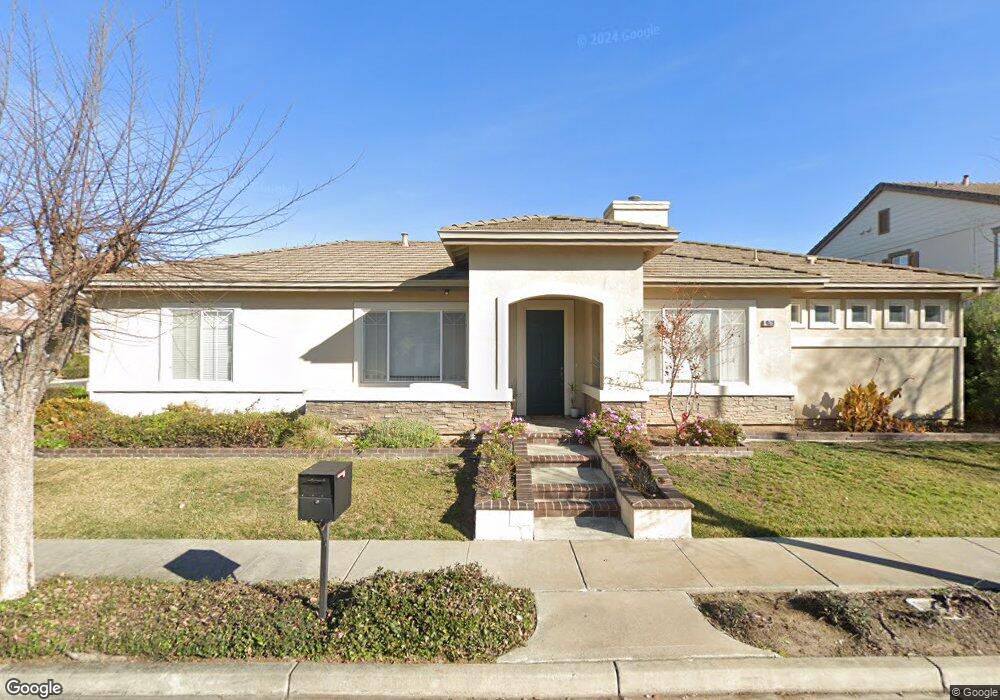
4520 Meyer Park Cir Fremont, CA 94536
Glenmoor NeighborhoodEstimated Value: $1,981,000 - $2,328,000
3
Beds
2
Baths
2,200
Sq Ft
$983/Sq Ft
Est. Value
About This Home
This home is located at 4520 Meyer Park Cir, Fremont, CA 94536 and is currently estimated at $2,162,425, approximately $982 per square foot. 4520 Meyer Park Cir is a home located in Alameda County with nearby schools including Glenmoor Elementary School, Centerville Junior High School, and Washington High School.
Ownership History
Date
Name
Owned For
Owner Type
Purchase Details
Closed on
Jul 12, 2002
Sold by
Chang David C and Lee Yu Hua
Bought by
Chang David C and Lee Yu Hua
Current Estimated Value
Home Financials for this Owner
Home Financials are based on the most recent Mortgage that was taken out on this home.
Original Mortgage
$300,700
Interest Rate
6.69%
Purchase Details
Closed on
Nov 16, 2000
Sold by
Viera John R and Viera Judith M
Bought by
Chang David C and Lee Yu Hua
Home Financials for this Owner
Home Financials are based on the most recent Mortgage that was taken out on this home.
Original Mortgage
$525,000
Outstanding Balance
$200,203
Interest Rate
8.37%
Estimated Equity
$1,962,222
Purchase Details
Closed on
Jul 2, 1999
Sold by
Summerhill Glenmoor Ltd
Bought by
Viera John R and Viera Judith M
Home Financials for this Owner
Home Financials are based on the most recent Mortgage that was taken out on this home.
Original Mortgage
$390,000
Interest Rate
6.87%
Create a Home Valuation Report for This Property
The Home Valuation Report is an in-depth analysis detailing your home's value as well as a comparison with similar homes in the area
Home Values in the Area
Average Home Value in this Area
Purchase History
| Date | Buyer | Sale Price | Title Company |
|---|---|---|---|
| Chang David C | -- | North American Title Co | |
| Chang David C | $700,000 | Fidelity National Title Co | |
| Viera John R | $532,500 | First American Title Guarant |
Source: Public Records
Mortgage History
| Date | Status | Borrower | Loan Amount |
|---|---|---|---|
| Closed | Chang David C | $300,700 | |
| Open | Chang David C | $525,000 | |
| Previous Owner | Viera John R | $390,000 |
Source: Public Records
Tax History Compared to Growth
Tax History
| Year | Tax Paid | Tax Assessment Tax Assessment Total Assessment is a certain percentage of the fair market value that is determined by local assessors to be the total taxable value of land and additions on the property. | Land | Improvement |
|---|---|---|---|---|
| 2025 | $12,455 | $1,047,710 | $316,413 | $738,297 |
| 2024 | $12,455 | $1,027,032 | $310,209 | $723,823 |
| 2023 | $12,126 | $1,013,760 | $304,128 | $709,632 |
| 2022 | $11,977 | $986,887 | $298,166 | $695,721 |
| 2021 | $11,680 | $967,400 | $292,320 | $682,080 |
| 2020 | $11,738 | $964,410 | $289,323 | $675,087 |
| 2019 | $11,602 | $945,503 | $283,651 | $661,852 |
| 2018 | $11,376 | $926,967 | $278,090 | $648,877 |
| 2017 | $11,091 | $908,795 | $272,638 | $636,157 |
| 2016 | $10,906 | $890,980 | $267,294 | $623,686 |
| 2015 | $10,765 | $877,603 | $263,281 | $614,322 |
| 2014 | $10,583 | $860,418 | $258,125 | $602,293 |
Source: Public Records
Map
Nearby Homes
- 4586 Norris Rd
- 4715 Eggers Dr
- 37826 Glenmoor Dr
- 4328 Cognina Ct
- 4948 Norris Rd
- 38265 Corrigan Ct
- 4715 Mildred Dr
- 37621 Glenmoor Dr
- 38324 Blacow Rd
- 37721 Madera Ct
- 37987 Alta Dr
- 37792 Colfax Ct
- 3810 Burton Common
- 4737 Deadwood Dr
- 5169 Lawler Ave
- 3833 Burton Common
- 38837 Fremont Blvd
- Plan 1725 at Veranda
- Plan 1670 at Veranda
- Plan 1657 at Veranda
- 4580 Meyer Park Cir
- 4530 Meyer Park Cir
- 4570 Meyer Park Cir
- 4519 Meyer Park Cir
- 4540 Meyer Park Cir
- 4523 Meyer Park Cir
- 4550 Meyer Park Cir
- 4583 Meyer Park Cir
- 4587 Meyer Park Cir
- 4579 Meyer Park Cir
- 4527 Meyer Park Cir
- 4560 Meyer Park Cir
- 4575 Meyer Park Cir
- 4531 Meyer Park Cir
- 4595 Meyer Park Cir
- 4515 Meyer Park Cir
- 38254 Glenmoor Dr
- 4550 Mattos Dr
- 4560 Mattos Dr
- 4540 Mattos Dr