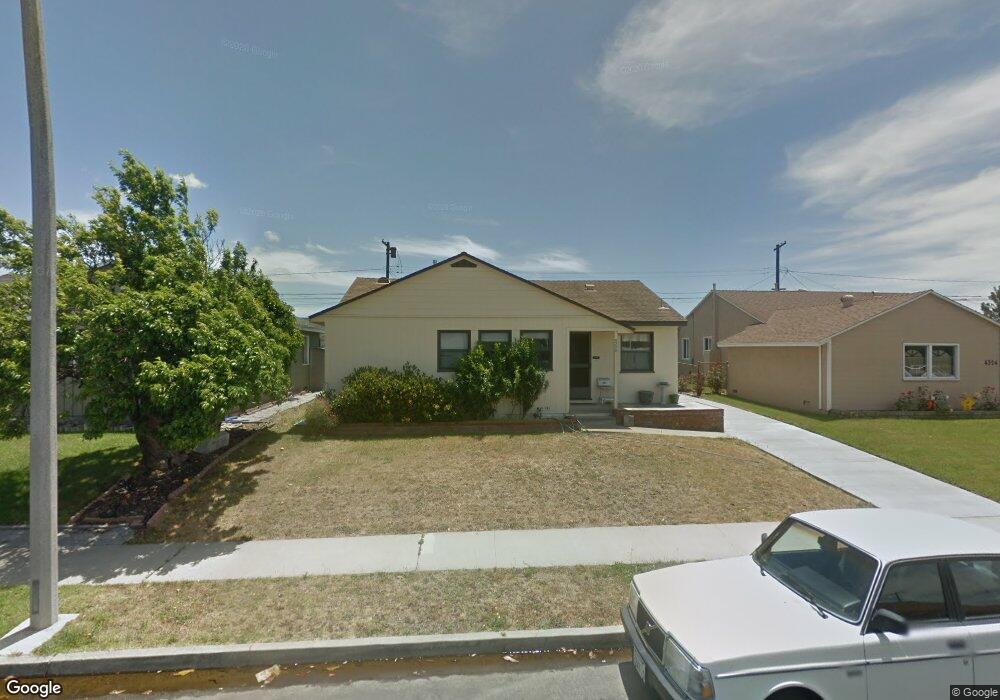
4520 Toucan St Torrance, CA 90503
West Torrance NeighborhoodEstimated Value: $1,161,000 - $1,268,000
3
Beds
1
Bath
1,098
Sq Ft
$1,094/Sq Ft
Est. Value
About This Home
This home is located at 4520 Toucan St, Torrance, CA 90503 and is currently estimated at $1,201,655, approximately $1,094 per square foot. 4520 Toucan St is a home located in Los Angeles County with nearby schools including Towers Elementary School, Bert M. Lynn Middle School, and West High School.
Ownership History
Date
Name
Owned For
Owner Type
Purchase Details
Closed on
Dec 31, 2024
Sold by
1999 Diana Holland Revocable Trust and Holland Diana
Bought by
Estrada Jose Luis and Estrada Marina Isbel
Current Estimated Value
Home Financials for this Owner
Home Financials are based on the most recent Mortgage that was taken out on this home.
Original Mortgage
$920,000
Outstanding Balance
$913,348
Interest Rate
6.6%
Mortgage Type
New Conventional
Estimated Equity
$288,307
Purchase Details
Closed on
Dec 27, 1999
Sold by
Holland Diana L
Bought by
Holland Diana and 1999 Diana Holland Revocable Trust
Purchase Details
Closed on
Dec 18, 1999
Sold by
Holland Trust Holland Bertha J Tr J E And B J
Bought by
Holland Diana L
Purchase Details
Closed on
Sep 24, 1999
Sold by
Holland Trust Holland Bertha J Tr J E And B J
Bought by
Holland Bertha J and James E Holland Irrevocable Exemption Tr
Create a Home Valuation Report for This Property
The Home Valuation Report is an in-depth analysis detailing your home's value as well as a comparison with similar homes in the area
Home Values in the Area
Average Home Value in this Area
Purchase History
| Date | Buyer | Sale Price | Title Company |
|---|---|---|---|
| Estrada Jose Luis | $1,150,000 | Progressive Title Company | |
| Holland Diana | -- | -- | |
| Holland Diana L | -- | -- | |
| Holland Bertha J | -- | -- |
Source: Public Records
Mortgage History
| Date | Status | Borrower | Loan Amount |
|---|---|---|---|
| Open | Estrada Jose Luis | $920,000 |
Source: Public Records
Tax History Compared to Growth
Tax History
| Year | Tax Paid | Tax Assessment Tax Assessment Total Assessment is a certain percentage of the fair market value that is determined by local assessors to be the total taxable value of land and additions on the property. | Land | Improvement |
|---|---|---|---|---|
| 2025 | $3,372 | $274,268 | $213,553 | $60,715 |
| 2024 | $3,372 | $268,891 | $209,366 | $59,525 |
| 2023 | $3,314 | $263,619 | $205,261 | $58,358 |
| 2022 | $3,271 | $258,451 | $201,237 | $57,214 |
| 2021 | $3,207 | $253,385 | $197,292 | $56,093 |
| 2019 | $3,118 | $245,872 | $191,442 | $54,430 |
| 2018 | $2,984 | $241,052 | $187,689 | $53,363 |
| 2016 | $2,847 | $231,693 | $180,401 | $51,292 |
| 2015 | $2,786 | $228,214 | $177,692 | $50,522 |
| 2014 | $2,722 | $223,745 | $174,212 | $49,533 |
Source: Public Records
Map
Nearby Homes
- 4606 Narrot St
- 19910 Bernist Ave
- 20017 Bernist Ave
- 4819 Halison St
- 4137 Konya Dr
- 20318 Regina Ave
- 2905 Spreckels Ct
- 2804 Spreckels Ln
- 18801 Hawthorne Blvd Unit 19
- 18801 Hawthorne Blvd Unit 59
- 4549 186th St
- 20515 Palm Way
- 4489 Spencer St Unit 224
- 20550 Earl St Unit 15
- 19219 Beckworth Ave
- 19509 Hinsdale Ave
- 18413 Burin Ave
- 2606 Ralston Ln
- 2708 184th St
- 20533 Eastwood Ave
- 4524 Toucan St
- 4516 Toucan St
- 4519 Deelane St
- 4528 Toucan St
- 4512 Toucan St
- 4523 Deelane St
- 4515 Deelane St
- 4527 Deelane St
- 4511 Deelane St
- 4519 Toucan St
- 4532 Toucan St
- 4508 Toucan St
- 4523 Toucan St
- 4515 Toucan St
- 4531 Deelane St
- 4527 Toucan St
- 4507 Deelane St
- 4511 Toucan St
- 4536 Toucan St
- 4504 Toucan St