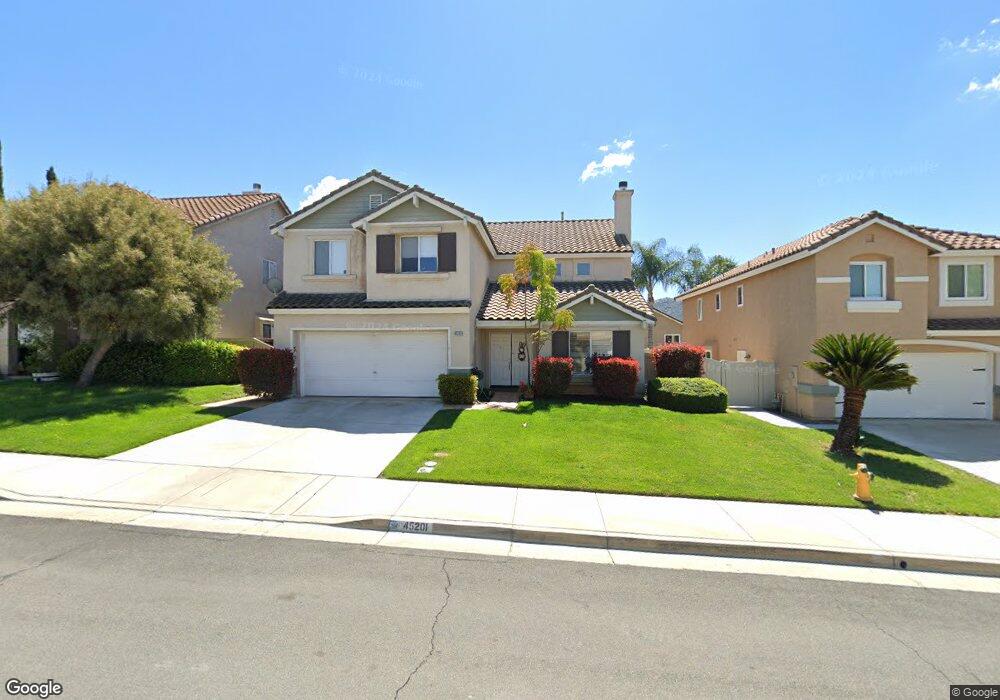
45201 Corte Progresso Temecula, CA 92592
Redhawk NeighborhoodEstimated Value: $728,337 - $878,000
6
Beds
3
Baths
2,574
Sq Ft
$312/Sq Ft
Est. Value
About This Home
This home is located at 45201 Corte Progresso, Temecula, CA 92592 and is currently estimated at $804,084, approximately $312 per square foot. 45201 Corte Progresso is a home located in Riverside County with nearby schools including Red Hawk Elementary, Erle Stanley Gardner Middle School, and Great Oak High School.
Ownership History
Date
Name
Owned For
Owner Type
Purchase Details
Closed on
Jan 25, 2013
Sold by
Perez Enrique and Perez Michelle L
Bought by
Perez Enrique and Perez Michelle L
Current Estimated Value
Home Financials for this Owner
Home Financials are based on the most recent Mortgage that was taken out on this home.
Original Mortgage
$244,900
Outstanding Balance
$167,531
Interest Rate
3.33%
Mortgage Type
New Conventional
Estimated Equity
$636,553
Purchase Details
Closed on
Oct 17, 2011
Sold by
Perez Enrique and Perez Michelle L
Bought by
Perez Enrique and Perez Michelle L
Purchase Details
Closed on
May 24, 1999
Sold by
Overland Redhawk Llc
Bought by
Perez Enrique and Perez Michelle L
Home Financials for this Owner
Home Financials are based on the most recent Mortgage that was taken out on this home.
Original Mortgage
$154,392
Interest Rate
6.84%
Mortgage Type
Purchase Money Mortgage
Create a Home Valuation Report for This Property
The Home Valuation Report is an in-depth analysis detailing your home's value as well as a comparison with similar homes in the area
Home Values in the Area
Average Home Value in this Area
Purchase History
| Date | Buyer | Sale Price | Title Company |
|---|---|---|---|
| Perez Enrique | -- | Title Source | |
| Perez Enrique | -- | Title Source | |
| Perez Enrique | -- | None Available | |
| Perez Enrique | $193,000 | First American Title Co |
Source: Public Records
Mortgage History
| Date | Status | Borrower | Loan Amount |
|---|---|---|---|
| Open | Perez Enrique | $244,900 | |
| Closed | Perez Enrique | $154,392 |
Source: Public Records
Tax History
| Year | Tax Paid | Tax Assessment Tax Assessment Total Assessment is a certain percentage of the fair market value that is determined by local assessors to be the total taxable value of land and additions on the property. | Land | Improvement |
|---|---|---|---|---|
| 2025 | $5,044 | $313,297 | $70,531 | $242,766 |
| 2023 | $5,044 | $301,134 | $67,794 | $233,340 |
| 2022 | $4,874 | $295,230 | $66,465 | $228,765 |
| 2021 | $4,770 | $289,442 | $65,162 | $224,280 |
| 2020 | $4,700 | $286,475 | $64,494 | $221,981 |
| 2019 | $4,631 | $280,859 | $63,230 | $217,629 |
| 2018 | $4,537 | $275,353 | $61,992 | $213,361 |
| 2017 | $4,453 | $269,955 | $60,777 | $209,178 |
| 2016 | $4,368 | $264,663 | $59,586 | $205,077 |
| 2015 | $4,287 | $260,690 | $58,692 | $201,998 |
| 2014 | $4,166 | $255,586 | $57,544 | $198,042 |
Source: Public Records
Map
Nearby Homes
- 45371 Corte Progreso
- 31725 Via Cordoba
- 31545 Via Cordoba
- 31868 Corte Montoya
- 45043 Corte Alegra
- 45418 Seagull Way
- 31687 Via San Carlos
- 45511 Seagull Way
- 45495 Peacock Place
- 32038 Corte Eldorado
- 32122 Corte Eldorado
- 32153 Caminito Osuna
- 45062 Corte Bella Donna
- 31935 Bitterroot Ct
- 45632 Corte Lobos
- 44681 Arbor Ln
- 31579 Mendocino Ct
- 45590 Alpine Place
- 45433 Vista Verde
- 45360 Vista Verde
- 45215 Corte Progresso
- 45193 Corte Progreso
- 45193 Corte Progresso
- 45230 Corte Palmito
- 45212 Corte Palmito
- 45175 Corte Progresso
- 45237 Corte Progresso
- 45258 Corte Palmito
- 45194 Corte Palmito
- 45208 Corte Progresso
- 45208 Corte Progreso
- 45167 Corte Progresso
- 45196 Corte Progresso
- 45251 Corte Progresso
- 45220 Corte Progreso
- 45176 Corte Palmito
- 45220 Corte Progresso
- 45184 Corte Progreso
- 45184 Corte Progresso
- 45266 Corte Palmito
Your Personal Tour Guide
Ask me questions while you tour the home.