
Landlord's Agent in 2016
Barry Evans
Greater Downtown Realty dba Keller Williams Realty
(423) 838-0606
118 Total Sales
Estimated Value: $305,000 - $322,000
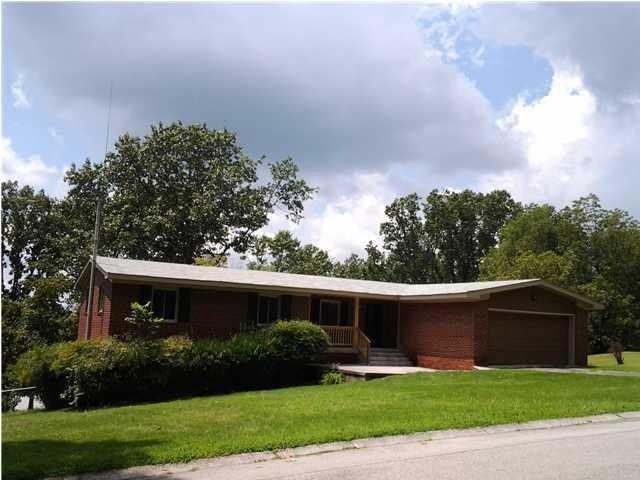
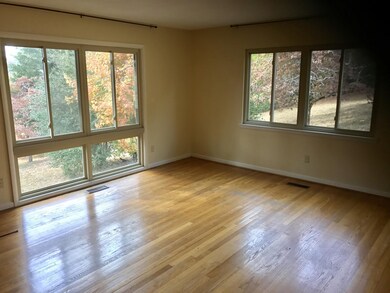
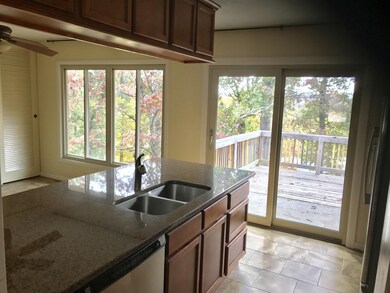
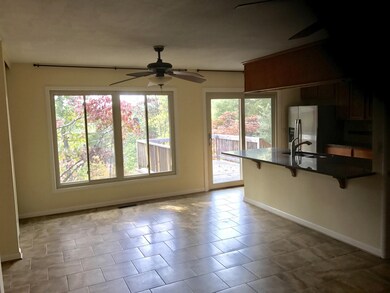
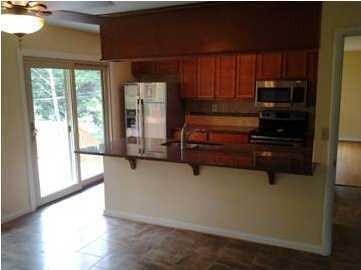
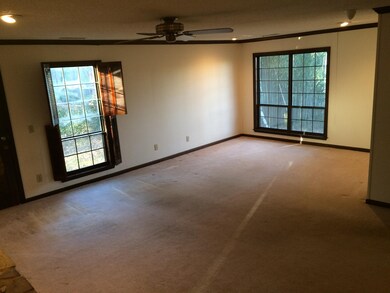
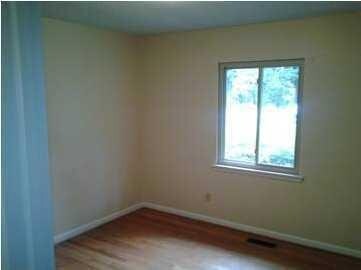
Updated gem-Hullco low-e windows and vinyl soffits installed in this all brick rancher. Kitchen-totally remodeled in 2012 with stainless appliances including refrigerator with ice/water in the door, built-in microwave and granite counters. Tile floors in entry, keeping room and kitchen with remainder of home in hardwood flooring. Great back deck and large fenced-in back yard. Basement is accessible from rear, full size crawl space door - concrete floor. Fabulous storage/workshop. **Owner preference $650 rent paid every other week** Absolutely no smoking on the property. No pets. No washer/dryer provided. Commission is 1/2 of first month rent.
Last Agent to Rent the Property
Greater Downtown Realty dba Keller Williams Realty Brokerage Phone: 4238380606 License #358084,215655 Listed on: 11/02/2016
| Date | Buyer | Sale Price | Title Company |
|---|---|---|---|
| Chapman Elise L | $140,000 | Northgate Title Ins Agcy Inc | |
| Chapman Elise | $88,900 | First Title |
| Date | Status | Borrower | Loan Amount |
|---|---|---|---|
| Open | Chapman Elise L | $112,000 |
| Date | Event | Price | List to Sale | Price per Sq Ft | Prior Sale |
|---|---|---|---|---|---|
| 12/15/2016 12/15/16 | Rented | -- | -- | -- | |
| 12/15/2016 12/15/16 | Under Contract | -- | -- | -- | |
| 11/02/2016 11/02/16 | For Rent | $1,408 | 0.0% | -- | |
| 08/01/2014 08/01/14 | Sold | $1,300 | 0.0% | $1 / Sq Ft | View Prior Sale |
| 08/01/2014 08/01/14 | Pending | -- | -- | -- | |
| 07/22/2014 07/22/14 | For Sale | $1,300 | 0.0% | $1 / Sq Ft | |
| 08/28/2012 08/28/12 | Sold | $1,300 | 0.0% | $1 / Sq Ft | View Prior Sale |
| 08/28/2012 08/28/12 | Pending | -- | -- | -- | |
| 08/10/2012 08/10/12 | For Sale | $1,300 | -98.5% | $1 / Sq Ft | |
| 05/15/2012 05/15/12 | Sold | $88,900 | -1.1% | $61 / Sq Ft | View Prior Sale |
| 04/13/2012 04/13/12 | Pending | -- | -- | -- | |
| 04/09/2012 04/09/12 | For Sale | $89,900 | -- | $62 / Sq Ft |
| Year | Tax Paid | Tax Assessment Tax Assessment Total Assessment is a certain percentage of the fair market value that is determined by local assessors to be the total taxable value of land and additions on the property. | Land | Improvement |
|---|---|---|---|---|
| 2025 | $1,317 | $86,900 | $0 | $0 |
| 2024 | $941 | $42,075 | $0 | $0 |
| 2023 | $941 | $42,075 | $0 | $0 |
| 2022 | $941 | $42,075 | $0 | $0 |
| 2021 | $941 | $42,075 | $0 | $0 |
| 2020 | $957 | $34,625 | $0 | $0 |
| 2019 | $957 | $34,625 | $0 | $0 |
| 2018 | $915 | $34,625 | $0 | $0 |
| 2017 | $957 | $34,625 | $0 | $0 |
| 2016 | $933 | $0 | $0 | $0 |
| 2015 | $1,826 | $33,725 | $0 | $0 |
| 2014 | $1,826 | $0 | $0 | $0 |
Landlord's Agent in 2016
Barry Evans
Greater Downtown Realty dba Keller Williams Realty
(423) 838-0606
118 Total Sales
D
Seller's Agent in 2012
David Kilgore
Crye-Leike, REALTORS
(423) 870-5202
45 Total Sales
Source: Realtracs
MLS Number: 2350515
APN: 109E-L-003
Disclaimer: Certain information contained herein is derived from information provided by parties other than Homes.com. All information provided is deemed reliable, but is not guaranteed to be accurate and should be independently verified.
![]() Based on information submitted to the MLS GRID. All data is obtained from various sources and may not have been verified by broker or MLS GRID. Supplied Open House Information is subject to change without notice. All information should be independently reviewed and verified for accuracy. Properties may or may not be listed by the office/agent presenting the information. Some IDX listings have been excluded from this website.
Based on information submitted to the MLS GRID. All data is obtained from various sources and may not have been verified by broker or MLS GRID. Supplied Open House Information is subject to change without notice. All information should be independently reviewed and verified for accuracy. Properties may or may not be listed by the office/agent presenting the information. Some IDX listings have been excluded from this website.
Based on information submitted to the MLS GRID
Ask me questions while you tour the home.